US Tech forecast: the downtrend is strengthening
The US Tech index is consolidating below the support level and is poised to decline further. The US Tech forecast for next week is negative.
US Tech forecast: key takeaways
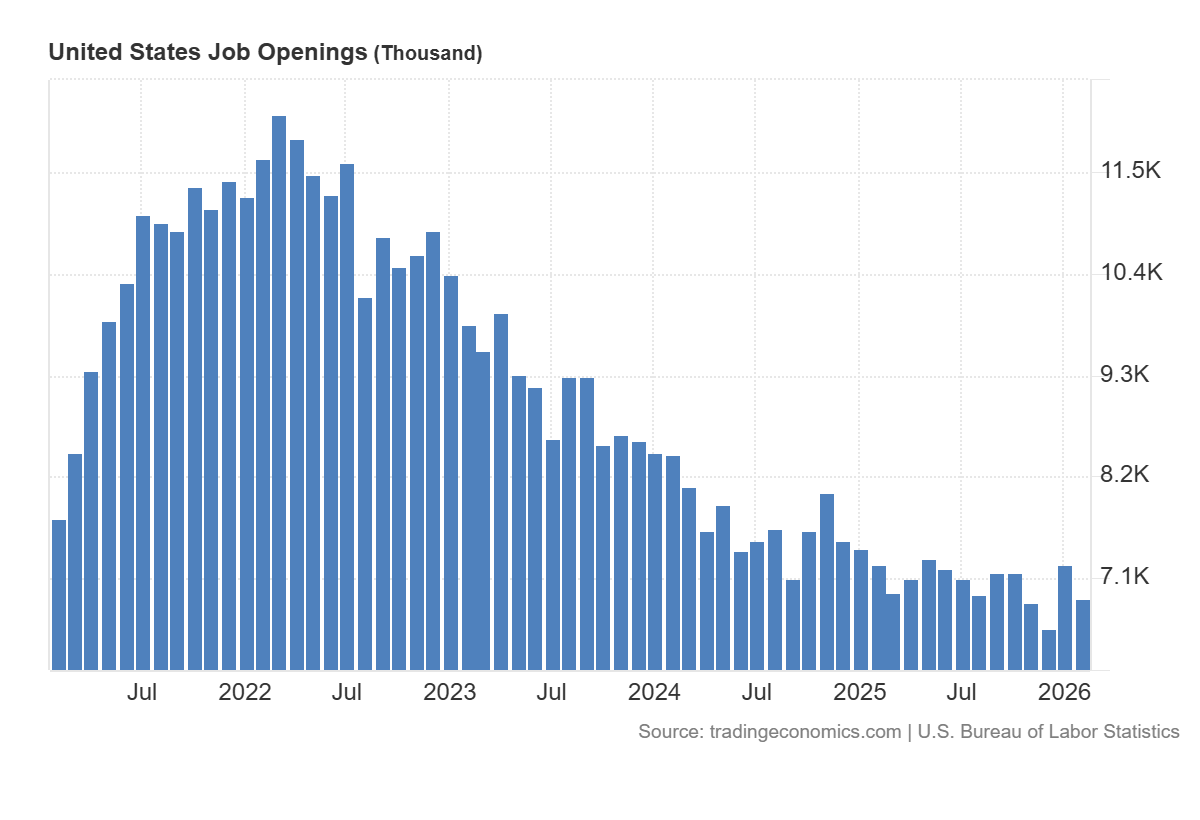
- Recent data: US JOLTS came in at 6.88 million in March
- Market impact: the current data has a mixed impact on the technology sector
US Tech fundamental analysis
The JOLTS data appears to be a moderately negative signal for the US economy and, at the moment, a neutral-to-negative signal for the US Tech index. Job openings fell to 6.882 million from 7.240 million a month earlier, coming in slightly below the forecast. At the same time, it was not only the number of vacancies that declined, but also the more significant underlying trend: hiring dropped to 4.849 million. For the technology sector, a weakening labour market reduces inflationary pressures and can support expectations of a more accommodative Federal Reserve policy, which is typically favourable for growth stocks.
For the US Tech, the key question now is which factor the market will treat as primary: lower rates in the future or weakening demand in the real economy. In the short term, such data often supports the largest tech companies with resilient cash flow and strong balance sheets, as they are best positioned to weather the downturn while also benefitting if bond yields decline.
US Tech technical analysis
For the US stock market overall, this data reinforces the view that the economy is losing momentum. A decline in openings alone does not necessarily mean an abrupt downturn, but combined with weaker hiring and a reduced willingness of workers to quit, it suggests more cautious behaviour from both employers and employees. For the broader market, this typically means weaker earnings growth expectations for sectors dependent on consumer spending and business activity.
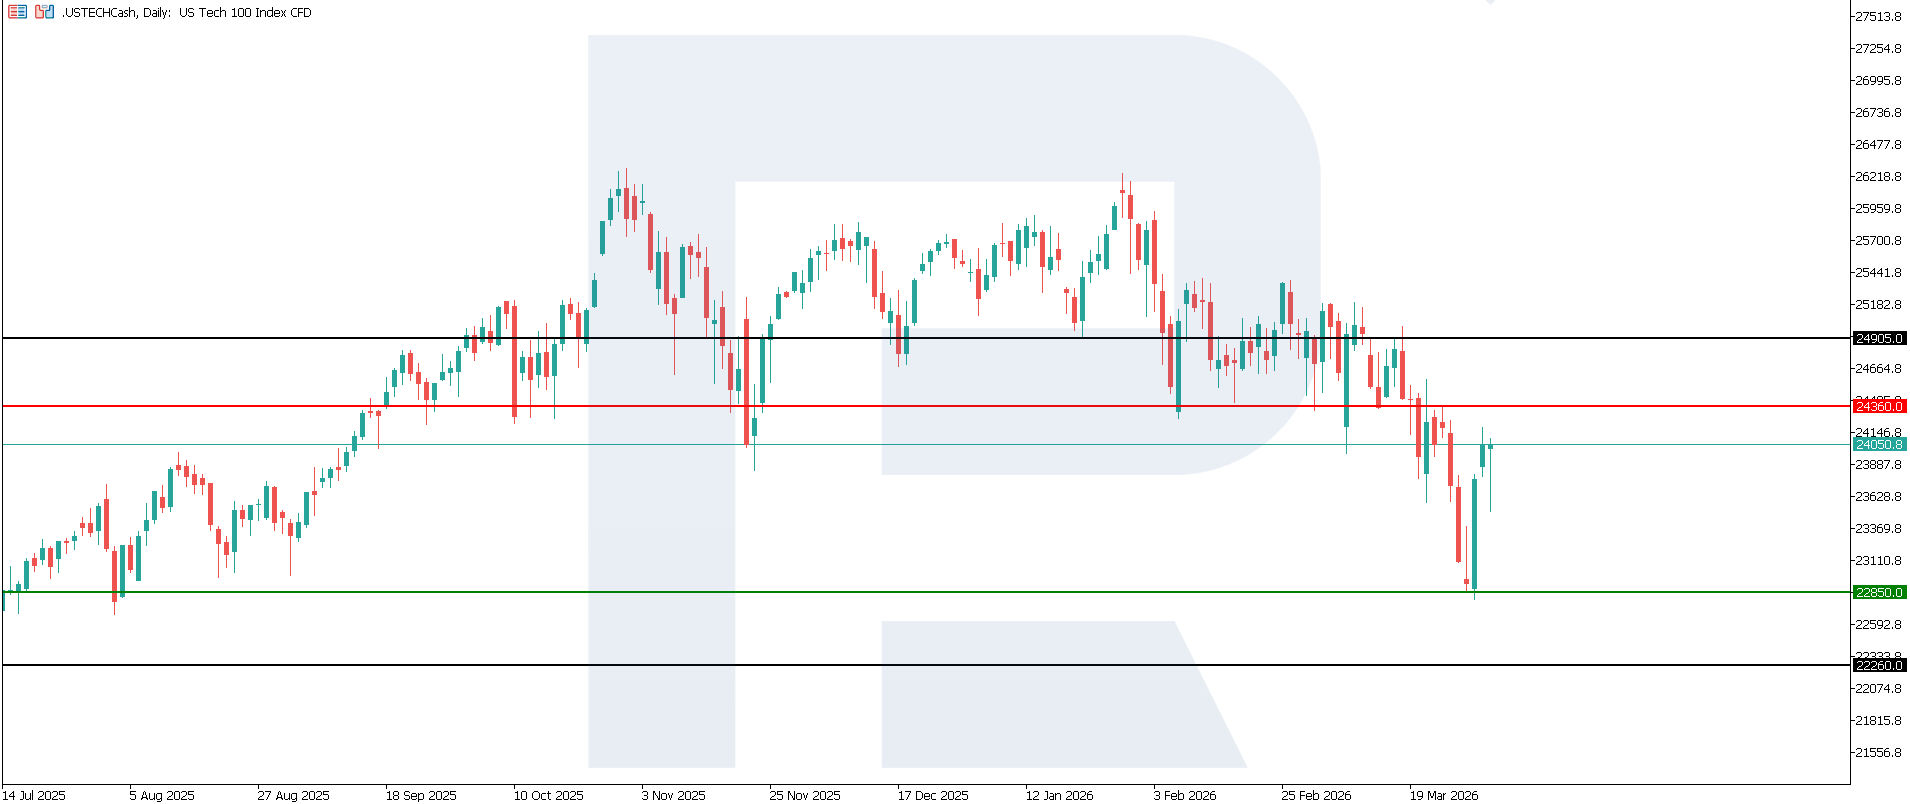
The US Tech index is showing downward momentum. The nearest resistance level is located at 24,360.0, while the main support level lies at 22,850.0. At the moment, prices are correcting. Volatility is elevated. If pressure persists, the next downside target could be 22,260.0.
The US Tech price forecast outlines the following scenarios:
- Pessimistic US Tech scenario: a breakout below the 22,850.0 support level could push the index to 22,260.0
- Optimistic US Tech scenario: a breakout above the 24,360.0 resistance level could boost the index up to 24,905.0
Summary
In the near term, the reaction will most likely depend on Treasury yields and Fed expectations. If yields decline after this release, the large-cap tech sector may show relative resilience. If the market focuses primarily on the risk of slower corporate earnings, then pressure may broaden both across the US Tech and the wider US stock market. The next downside target could be 22,260.0.
Editors’ picks
 EURUSD 2026-2027 forecast: key market trends and future predictions
This article provides the EURUSD forecast for 2026 and 2027 and highlights the main factors determining the direction of the pair’s movements. We will apply technical analysis, take into account the opinions of leading experts, large banks, and financial institutions, and study AI-based forecasts. This comprehensive insight into EURUSD predictions should help investors and traders make informed decisions.
 Gold (XAUUSD) forecast 2026 and beyond: expert insights, price predictions, and analysis
Dive deep into the Gold (XAUUSD) price outlook for 2026 and beyond, combining technical analysis, expert forecasts, and key macroeconomic factors. It explains the drivers behind gold’s recent surge, explores potential scenarios including a move toward 4,500 to 5,000 USD per ounce, and highlights why the metal remains a strong hedge during global uncertainty.
Forecasts presented in this section only reflect the author’s private opinion and should not be considered as guidance for trading. RoboForex bears no responsibility for trading results based on trading recommendations described in these analytical reviews.