US 30 forecast: the index has entered a downtrend amid rising geopolitical tensions
The US 30 correction has turned into a decline due to escalating geopolitical tensions between the EU and the US. The US 30 forecast for today is negative.
US 30 forecast: key takeaways
- Recent data: US industrial production rose by 0.4% month-on-month in December compared to November 2025
- Market impact: the data is moderately positive for the equity market
US 30 fundamental analysis
US industrial production increased by 0.4% month-on-month, exceeding the forecast of +0.1% and matching the previous reading of +0.4%. This result points to stronger-than-expected momentum in the real sector and confirms the resilience of industrial output. For the US stock market overall, this is a constructive signal, as it reduces concerns about a sharp economic slowdown and supports expectations for revenues and profits, especially in cyclical segments tied to manufacturing, transportation, and investment demand. Importantly, the indicator did not accelerate compared to the previous month, lowering the risk that markets interpret the data as a sign of overheating.
For the US 30, stronger industrial production supports expectations for business activity, order flows, and logistics, which is favourable for industrial issuers and cyclically sensitive companies. At the same time, a potential rise in bond yields can be a mixed factor for the financial sector: it may improve net interest income, but also restrain overall market valuations. In practice, unless rate expectations are sharply revised, the balance of factors typically leans towards a moderately positive impact on the US 30. However, the Greenland issue and the EU–US confrontation currently offset much of the macroeconomic upside.

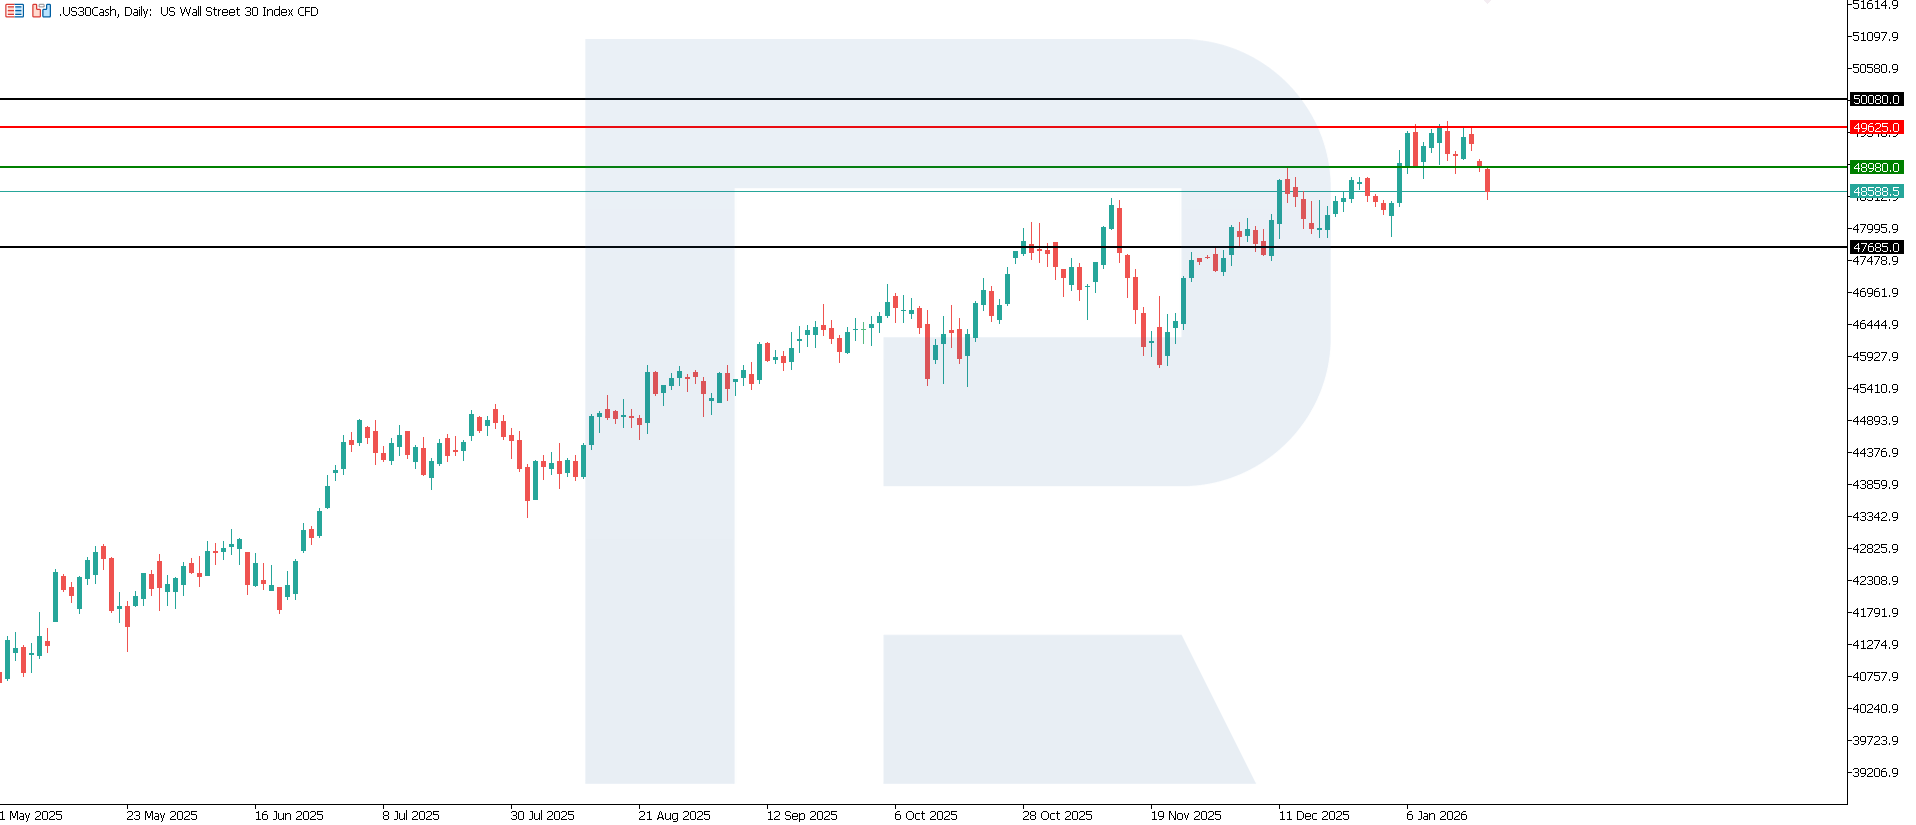
US 30 technical analysis
The US 30 index has entered a downward phase, breaking below the key support level around 48,980.0. The resistance level has shifted to 49,625.0. The index slipped below levels seen at the beginning of the year, with the nearest downside target at 47,685.0.
The US 30 price forecast considers the following scenarios:
- Pessimistic US 30 scenario: if the price consolidates below the previously breached support level at 48,980.0, the index could fall to 47,685.0
- Optimistic US 30 scenario: a breakout above the 49,980.0 resistance level could drive the index up to 50,080.0
Summary
US industrial production at +0.4%, significantly above expectations, is a positive signal for US equities as it confirms resilient economic activity. For the US 30, the impact will likely be moderately supportive via its cyclical components, although upside potential may be partially capped by interest-rate market reactions. The nearest downside target could be 47,685.0.
Editors’ picks
 EURUSD 2026-2027 forecast: key market trends and future predictions
This article provides the EURUSD forecast for 2026 and 2027 and highlights the main factors determining the direction of the pair’s movements. We will apply technical analysis, take into account the opinions of leading experts, large banks, and financial institutions, and study AI-based forecasts. This comprehensive insight into EURUSD predictions should help investors and traders make informed decisions.
 Gold (XAUUSD) forecast 2026 and beyond: expert insights, price predictions, and analysis
Dive deep into the Gold (XAUUSD) price outlook for 2026 and beyond, combining technical analysis, expert forecasts, and key macroeconomic factors. It explains the drivers behind gold’s recent surge, explores potential scenarios including a move toward 4,500 to 5,000 USD per ounce, and highlights why the metal remains a strong hedge during global uncertainty.
Forecasts presented in this section only reflect the author’s private opinion and should not be considered as guidance for trading. RoboForex bears no responsibility for trading results based on trading recommendations described in these analytical reviews.