World indices overview: news from US 30, US 500, US Tech, JP 225, and DE 40 for 27 May 2025
US trade policy remains the main factor influencing global stock indices. Following the decision to temporarily suspend new tariffs on the EU, investor optimism has grown. Find out more in our analysis and forecast for global indices for 27 May 2025.
US indices forecast: US 30, US 500, US Tech
- Recent data: US services PMI for May (preliminary) came in at 52.3
- Market impact: a higher PMI indicates economic growth, typically supporting stocks in consumer services, finance, and technology sectors
Fundamental analysis
A stronger-than-expected PMI signals that the US economy remains resilient. While this is a moderately positive signal for the stock market, the reaction may remain subdued if investors expect the Federal Reserve to delay rate cuts due to strong macroeconomic data.
Additionally, the tariff issue with the EU remains unresolved. The decision to impose 50% tariffs and then temporarily suspend them has once again increased uncertainty among investors. However, drawing a parallel with the similar case involving China, the probability of a new trade agreement between the EU and the US remains fairly high.
US 30 technical analysis
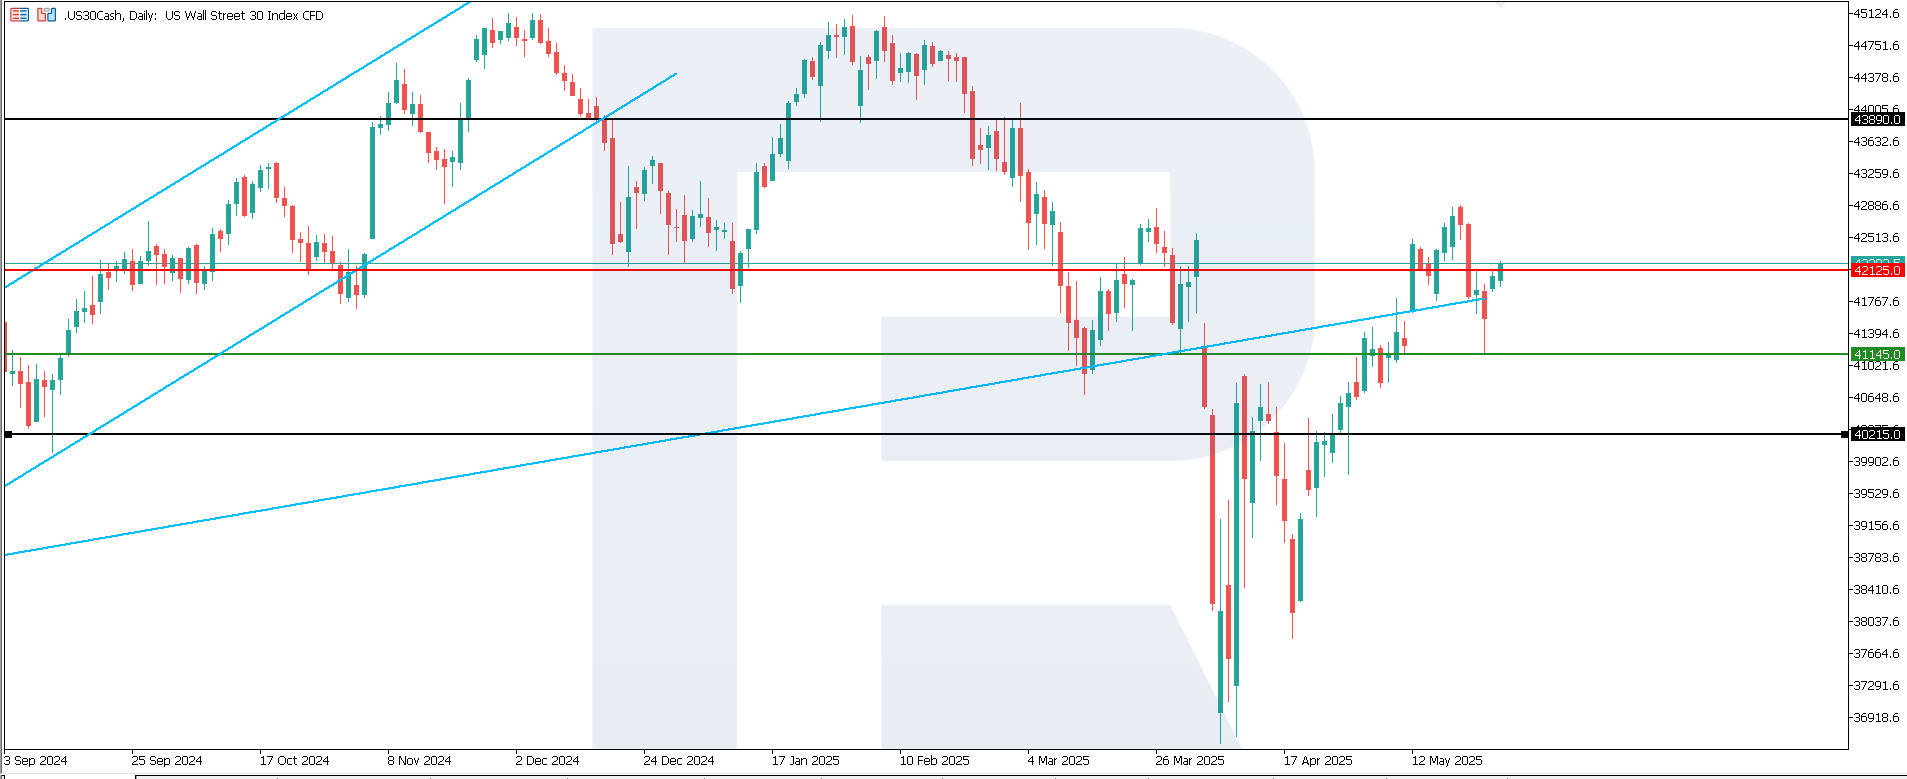
The US 30 index broke below the recently formed support level at 41,940.0, with the resistance level shifting to 42,125.0 and a new support forming at 41,145.0. The situation in the US 30 remains uncertain. The downtrend is rather weak.
The following scenarios are considered for the US 30 price forecast:
- Pessimistic US 30 forecast: a breakout below the 41,145.0 support level could push the index to 40,215.0
- Optimistic US 30 forecast: a breakout above the 42,125.0 resistance level could drive the index to 43,890.0
US 500 technical analysis
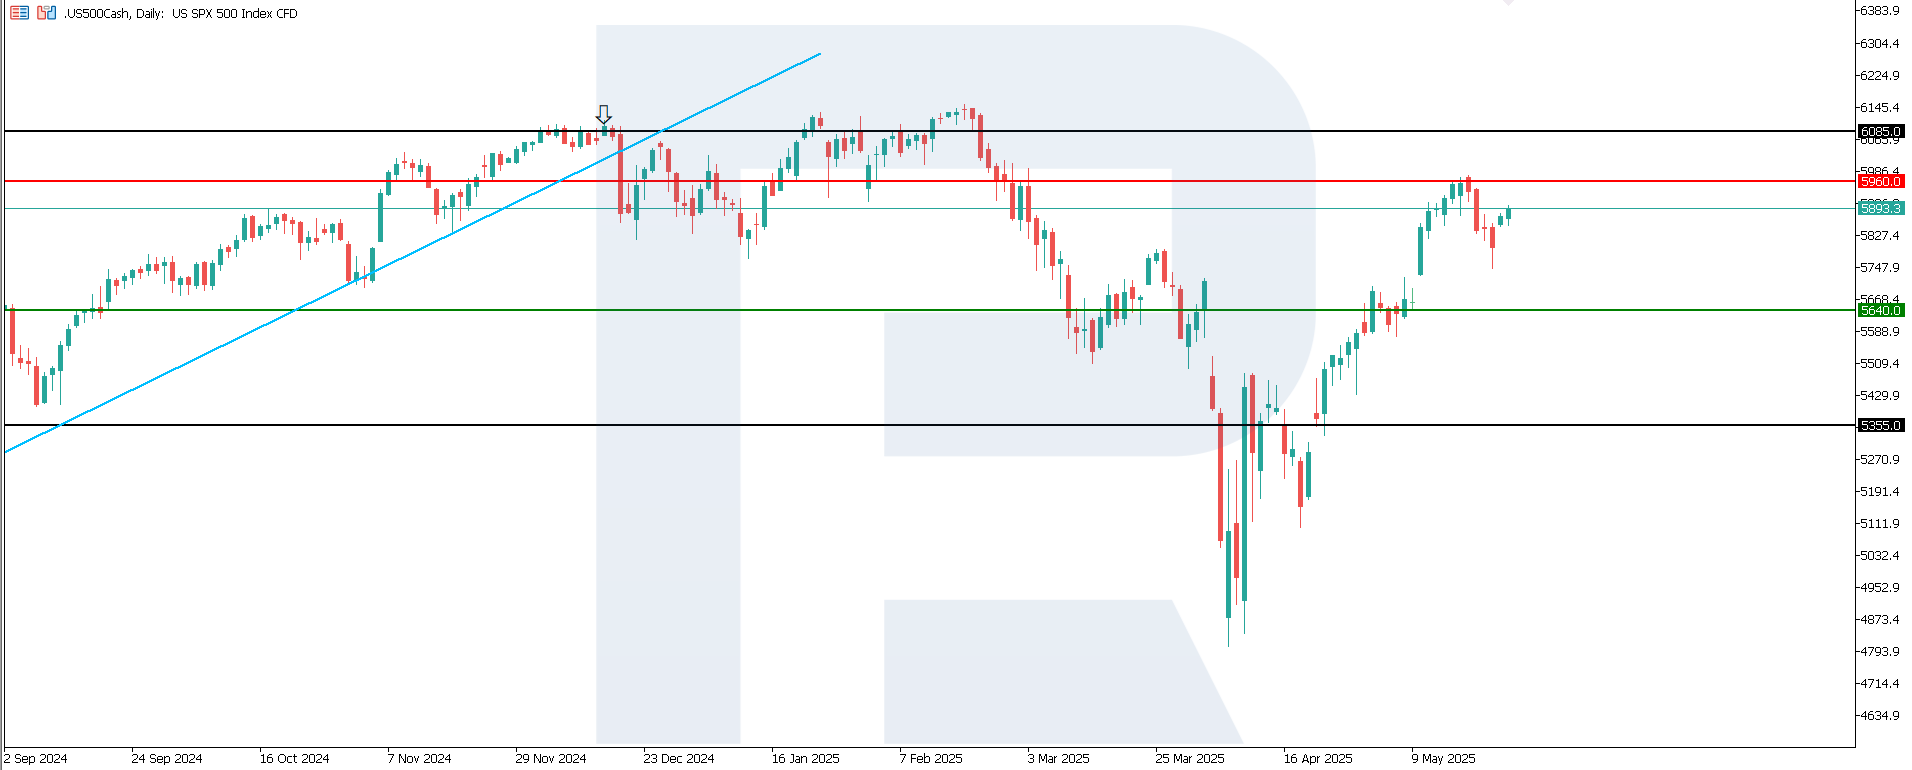
The US 500 index has entered a corrective phase, with the support area shifting down to 5,640.0 and new resistance forming at 5,960.0. The correction is moderate and does not yet indicate a change in the main trend. The upward movement remains and could develop into a sustained medium-term trend.
The following scenarios are considered for the US 500 price forecast:
- Pessimistic US 500 forecast: a breakout below the 5,640.0 support level could send the index down to 5,355.0
- Optimistic US 500 forecast: a breakout above the 5,960.0 resistance level could propel the index to 6,085.0
US Tech technical analysis
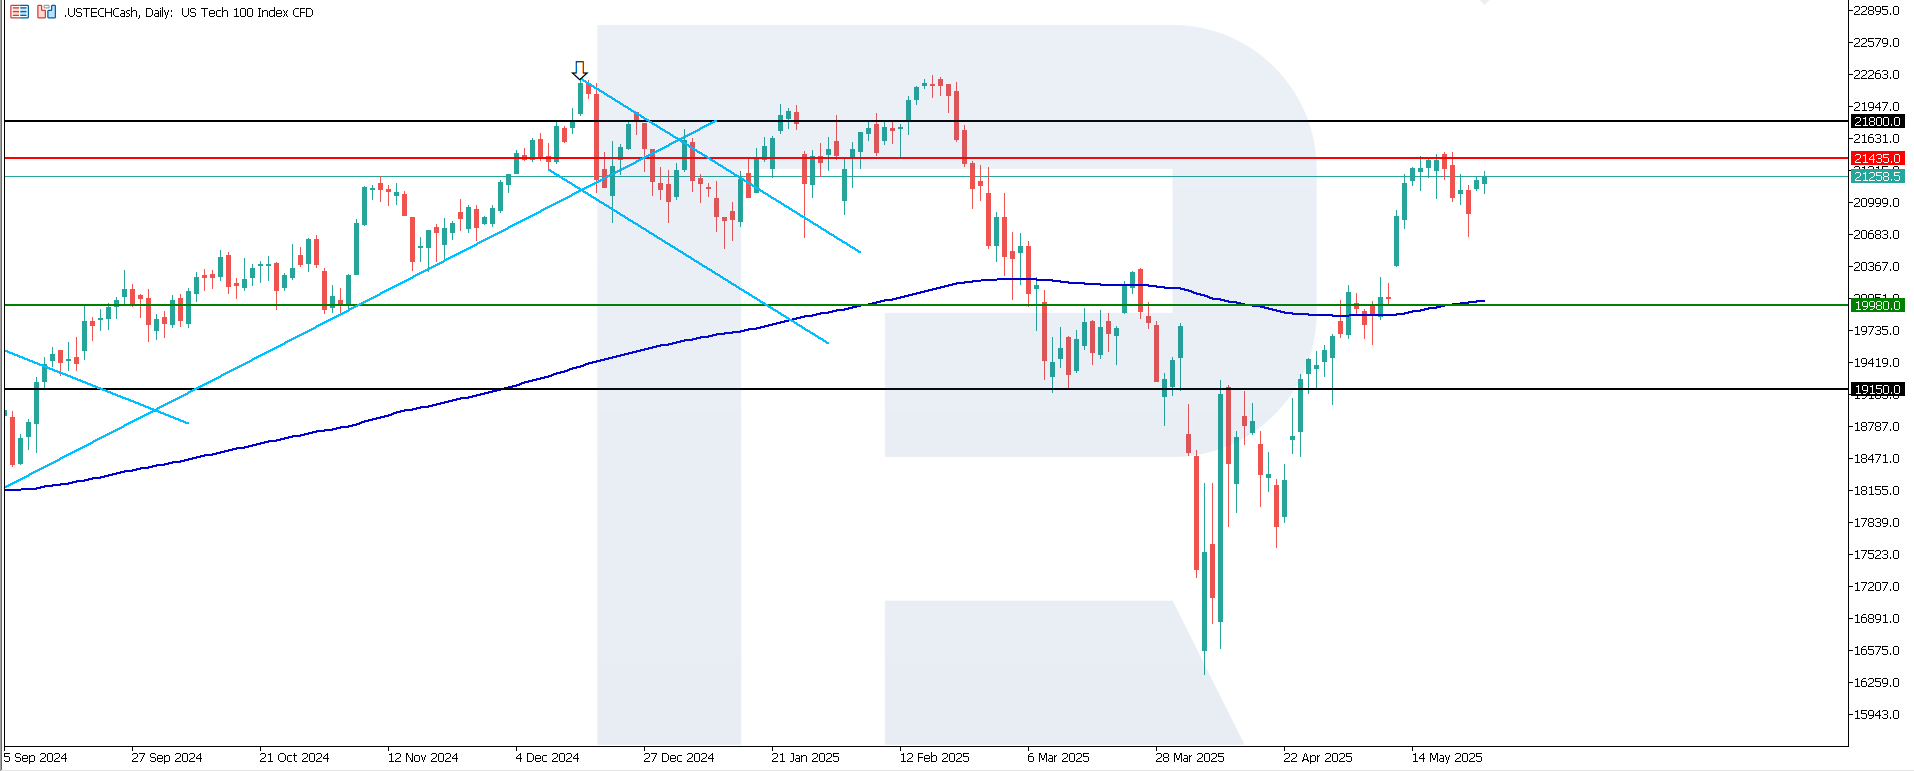
The US Tech index has consolidated above the 200-day Moving Average, indicating persistent upward momentum. The support line has shifted to 19,980.0, and the resistance level is marked at 21,435.0. Given the current dynamics, the likelihood of forming a medium-term uptrend remains high.
The following scenarios are considered for the US Tech price forecast:
- Pessimistic US Tech forecast: a breakout below the 19,980.0 support level could push the index down to 19,150.0
- Optimistic US Tech forecast: a breakout above the 21,435.0 resistance level could boost the index to 21,800.0
Asian index forecast: JP 225
- Recent data: Japan's core CPI stood at 3.5% year-on-year in May
- Market impact: bond yields may rise, while the stock market may decline slightly, especially in rate-sensitive sectors
Fundamental analysis
Higher inflation intensifies speculation over yen strengthening, which may pressure shares of Japanese exporters like Toyota, Sony, and Canon as a stronger yen reduces the competitiveness of their goods abroad. At the same time, a potential interest rate hike could support shares of banks and insurance firms as they benefit from widening interest margins.
Japan’s stronger-than-expected core CPI indicates rising inflationary pressure, potentially prompting the Bank of Japan to accelerate policy normalisation. This creates mixed signals for the Japanese stock market: positive for the financial sector, but potentially negative for exporters and rate-sensitive companies.
JP 225 technical analysis
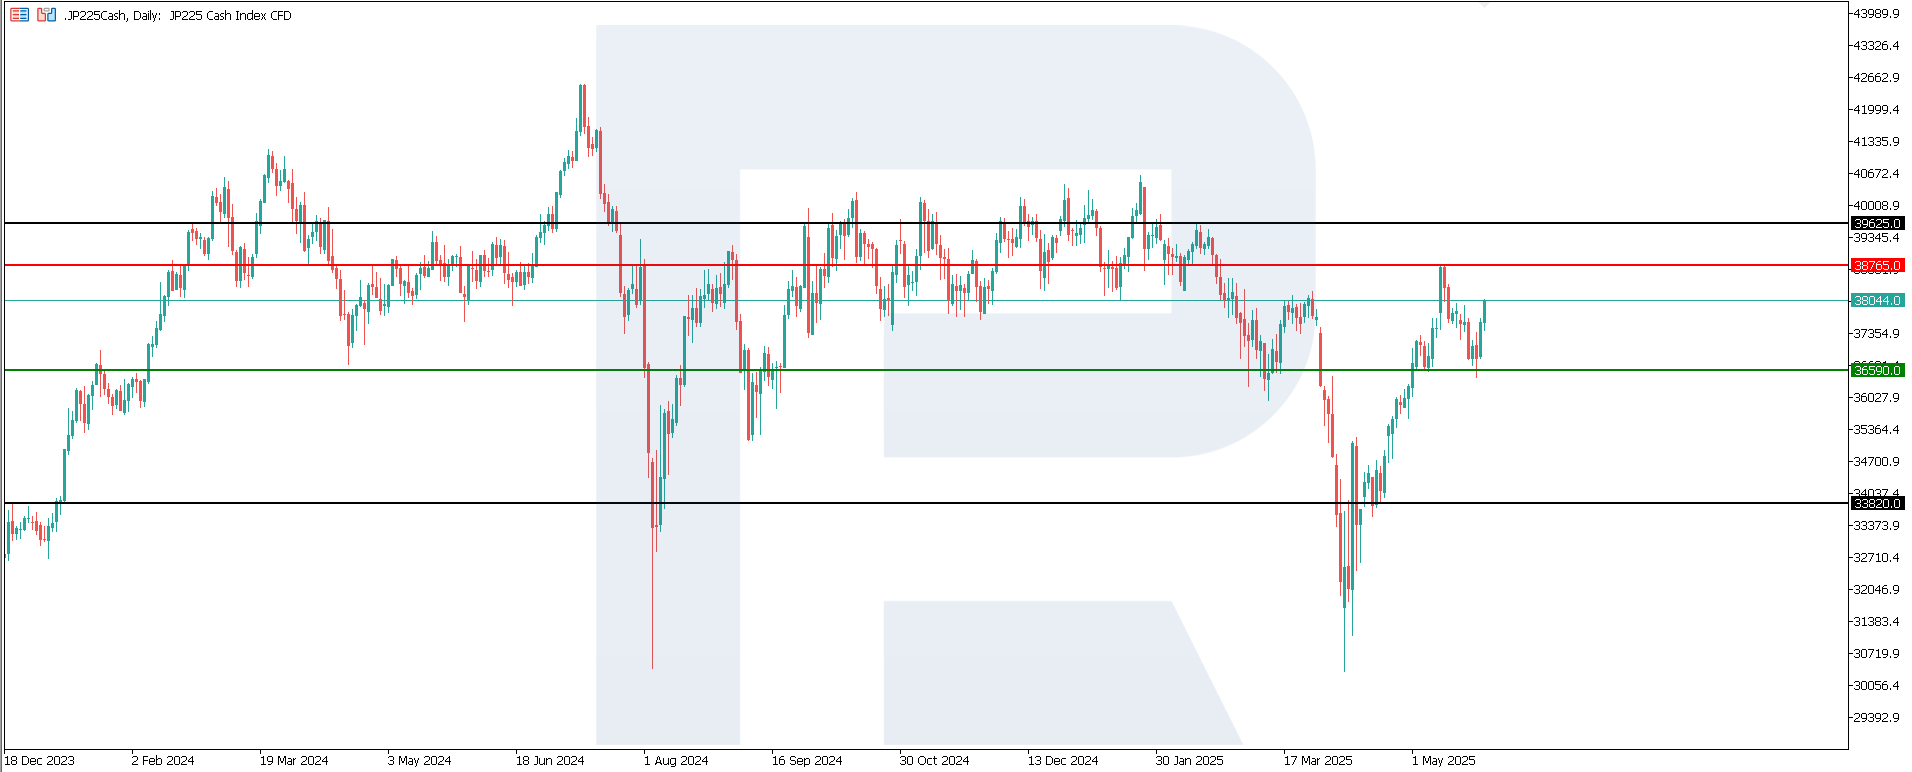
The JP 225 index left a medium-term sideways range, breaking above the 38,130.0 resistance level. This move could signal the beginning of a bullish reversal, although the risk of a false breakout remains. The formation of a new resistance level at 38,765.0 increases the likelihood of upward momentum.
The following scenarios are considered for the JP 225 price forecast:
- Pessimistic JP 225 forecast: a breakout below the 36,590.0 support level could push the index down to 33,820.0
- Optimistic JP 225 forecast: a breakout above the 38,765.0 resistance level could drive the index to 39,625.0
European index forecast: DE 40
- Recent data: Germany’s GDP for May preliminarily rose by 0.4% year-on-year
- Market impact: the better-than-expected result may serve as a positive signal for Germany’s stock market
Fundamental analysis
Germany’s GDP reflects the quarterly change in the total value of goods and services produced in the country. It is a key indicator of economic activity. A +0.4% GDP growth in Q1 2025 compared to the previous quarter (-0.2%) signals recovery after a downturn and beats market expectations of +0.2%.
GDP growth boosts investor confidence in the economy’s resilience, supporting stock prices, especially in cyclical sectors such as industry, finance, and consumer goods. Additionally, a stronger economy reduces the likelihood of imminent monetary easing by the ECB, which may pressure rate-sensitive sectors such as real estate. Overall, this level of GDP supports the stock market and improves investor sentiment.
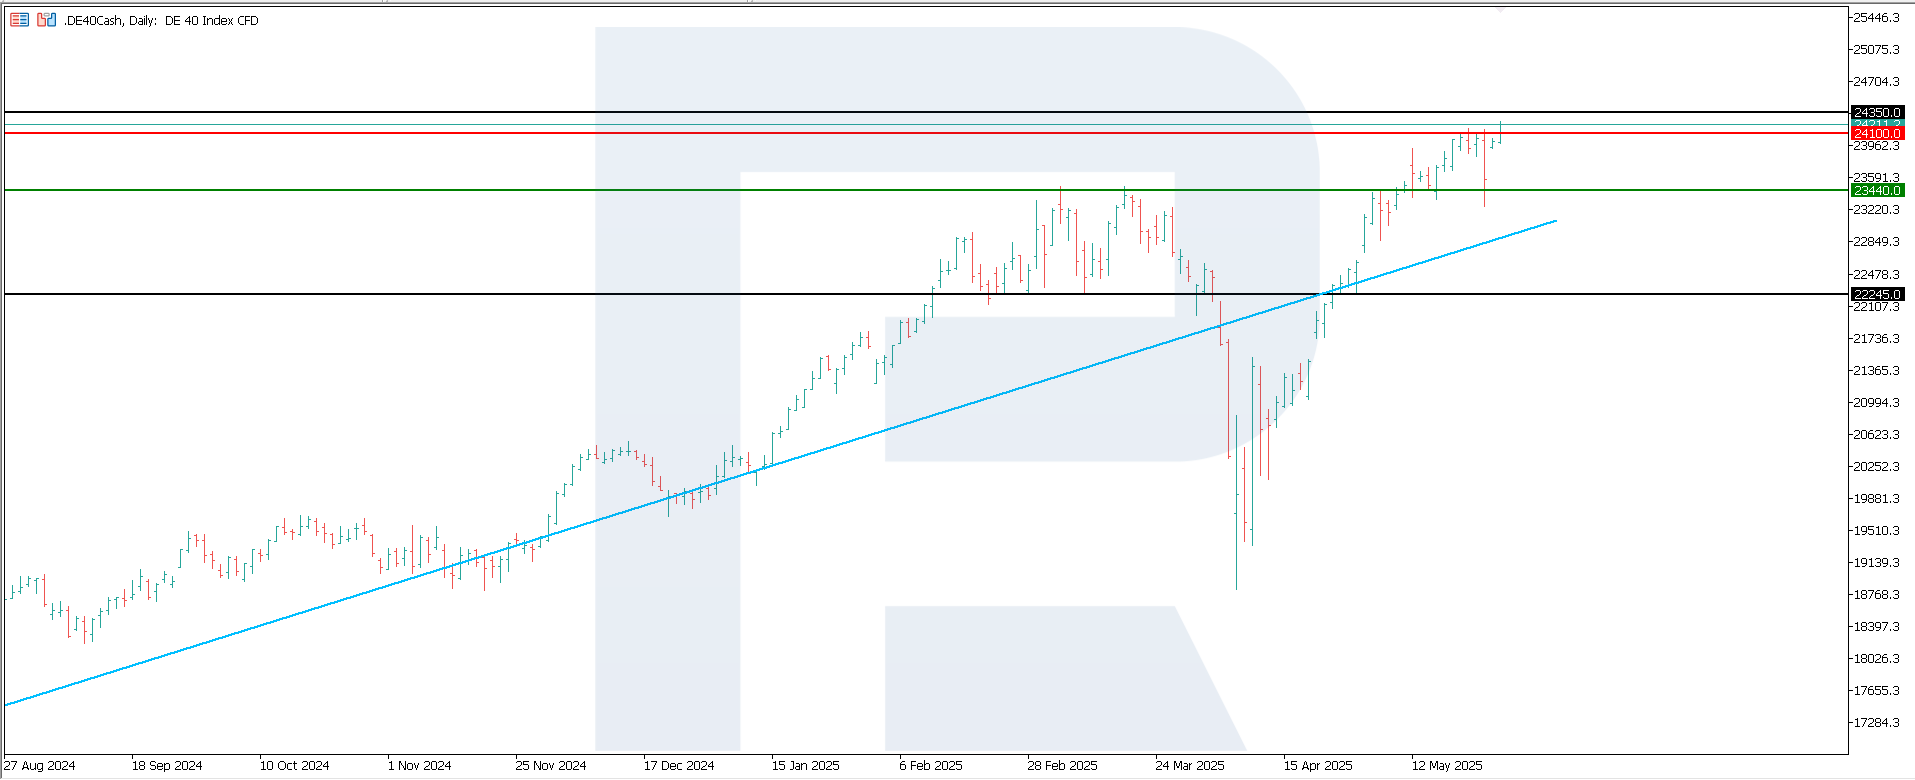
DE 40 technical analysis
The DE 40 stock index has formed key levels, with resistance at 24,100.0 and support at 23,440.0. The current trend indicates a corrective decline, but if the support level holds, the uptrend may resume.
The following scenarios are considered for the DE 40 price forecast:
- Pessimistic DE 40 forecast: a breakout below the 23,440.0 support level could send the index down to 22,245.0
- Optimistic DE 40 forecast: a breakout above the 24,100.0 resistance level could propel the index to 24,345.0
Summary
After the US imposed and then postponed 50% tariffs on EU goods, markets have changed local trends multiple times. The US 30 index broke below the support level again and reversed the early signs of an uptrend. Japan’s JP 225 is climbing towards the current resistance level. The US 500 and US Tech levels continue to trade in an uptrend, and Germany’s DE 40 aims for another all-time high.
Forecasts presented in this section only reflect the author’s private opinion and should not be considered as guidance for trading. RoboForex bears no responsibility for trading results based on trading recommendations described in these analytical reviews.