USDJPY in correction phase, but the overall trend remains positive
The USDJPY pair stabilised near 158.30, with political news and signals from the Bank of Japan currently the most important factors. Find more details in our analysis for 20 January 2026.
USDJPY forecast: key takeaways
- The USDJPY pair maintains an upward structure
- The market is closely monitoring changes in Japan’s policy
- Investors are awaiting hawkish signals from the Bank of Japan
- USDJPY forecast for 20 January 2026: 158.30
Fundamental analysis
The USDJPY rate closed at 158.03 on Tuesday. The previous session was volatile amid rising political uncertainty in Japan.
Japan’s Prime Minister Sanae Takaichi announced the dissolution of parliament on Friday and the holding of snap general elections on 8 February.
The vote will cover all 465 seats in the lower house and will become the first electoral test for Takaichi since taking office. The goal is to secure voter support for the implementation of expansionary budget plans and key political initiatives. Additional market attention focuses on the Bank of Japan meeting this week.
The regulator is expected to keep the interest rate unchanged after the December increase, but investors will look for more hawkish signals in comments from BoJ Governor Kazuo Ueda amid speculation about a possible rate hike in June. Market participants also continue to factor in the risk of currency intervention, aware of the impact of a weak yen on domestic inflation.
The USDJPY forecast is mixed.
Technical outlook
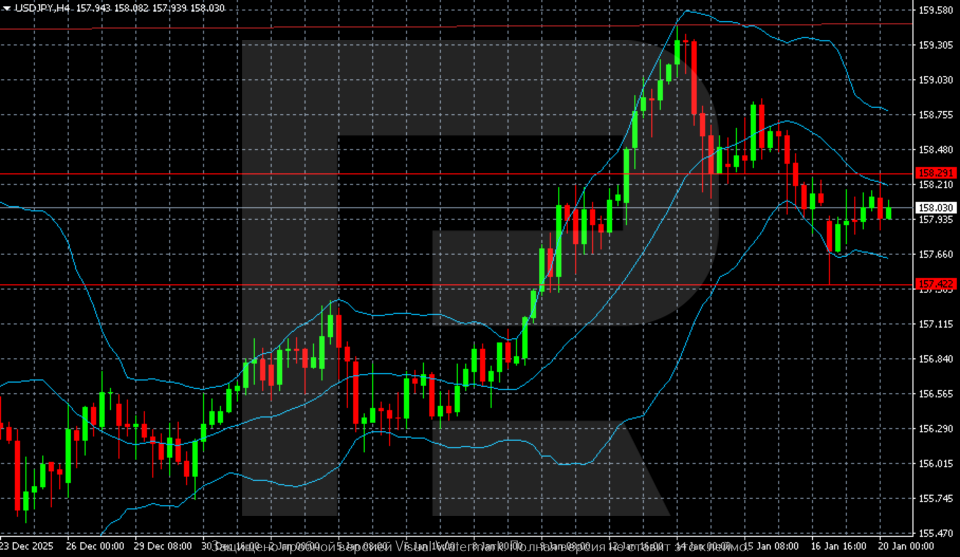
On the H4 chart, the USDJPY pair maintains an upward structure that formed in late December. The main growth impulse occurred during the period from 8 to 13 January, when the pair accelerated from the 156.5–157.0 area and hit a new local high near 159.5. After reaching the peak, the market moved into a corrective phase without a sharp break in the trend.
Currently, quotes are consolidating within the 157.9–158.3 range near the middle line of the Bollinger Bands, indicating a pause after a strong move and a decline in volatility. The upper boundary of the 158.3–158.5 range acts as the nearest resistance, while the 157.4–157.5 zone remains key support. Stronger resistance persists in the 159.3–159.6 area, where the previous impulse high was recorded.
Technically, the market appears resilient: the Bollinger Bands have begun to narrow, which is characteristic of an accumulation phase ahead of the next move. As long as the price holds above 157.4, the baseline scenario remains moderately bullish, with the risk of a renewed test of higher levels. A breakout below 157.4 will become the first signal of weakening upward momentum and will increase the probability of a deeper correction towards 157.0 and lower.
USDJPY overview
- Asset: USDJPY
- Timeframe: H4 (Intraday / Short-term)
- Trend: Moderately bullish
- Key resistance levels: 158.50 and 159.50
- Key support levels: 157.40 and 157.00
USDJPY trading scenarios for today
Main scenario (Buy Limit)
A corrective decline to the 157.40–157.50 area may create conditions for opening long positions while maintaining the upward structure of USDJPY.
The current consolidation following the 8–13 January impulse represents a pause without a trend break. The narrowing of the Bollinger Bands indicates an accumulation phase ahead of the next move.
The risk-to-reward ratio exceeds 1:4, making the scenario attractive under controlled risk.
- Buy Limit: 157.45
- Take Profit: 158.30 / 158.50
- Stop Loss: 156.95
Alternative scenario (Sell Stop)
Selling becomes relevant if the price breaks and consolidates below 157.40, which will serve as the first signal of weakening upward momentum and a transition to a deeper correction.
- Sell Stop: 157.35
- Take Profit: 157.00
- Stop Loss: 157.85
Risk factors
Risk factors for the bullish USDJPY scenario include possible hawkish signals from the Bank of Japan and rising expectations of a rate hike as early as June. Stronger regulatory rhetoric or currency intervention in response to yen weakness may lead to a sharp strengthening of the JPY and a break in the current upward momentum.
Summary
The USDJPY pair is undergoing a correction while maintaining the primary trend. The USDJPY forecast for today, 20 January 2026, does not rule out renewed growth towards the 158.30 level.
Editors’ picks
 EURUSD 2026-2027 forecast: key market trends and future predictions
This article provides the EURUSD forecast for 2026 and 2027 and highlights the main factors determining the direction of the pair’s movements. We will apply technical analysis, take into account the opinions of leading experts, large banks, and financial institutions, and study AI-based forecasts. This comprehensive insight into EURUSD predictions should help investors and traders make informed decisions.
 Gold (XAUUSD) forecast 2026 and beyond: expert insights, price predictions, and analysis
Dive deep into the Gold (XAUUSD) price outlook for 2026 and beyond, combining technical analysis, expert forecasts, and key macroeconomic factors. It explains the drivers behind gold’s recent surge, explores potential scenarios including a move toward 4,500 to 5,000 USD per ounce, and highlights why the metal remains a strong hedge during global uncertainty.
Forecasts presented in this section only reflect the author’s private opinion and should not be considered as guidance for trading. RoboForex bears no responsibility for trading results based on trading recommendations described in these analytical reviews.