EURUSD gains support amid US tariff threats
The EURUSD rate is correcting after a strong momentum rally the day before, with buyers preparing to test the key resistance level at 1.1830. Discover more in our analysis for 26 February 2026.
EURUSD forecast: key takeaways
- Financial markets are pricing in unchanged rates at the upcoming Federal Reserve meeting
- Traders estimate a 98% probability that the current rate range will be maintained
- The probability assessment remained virtually unchanged compared to the previous day
- EURUSD forecast for 26 February 2026: 1.1920
Fundamental analysis
The EURUSD rate gained support after US Trade Representative Jamieson Greer stated that US tariff rates for some countries could rise to 15% or higher, up from the recently introduced 10%, without providing further details. The market interpreted this as an escalation of trade risks, triggering a decline in demand for the US dollar.
Financial markets are almost unanimously pricing in that US interest rates will remain unchanged following the upcoming Federal Reserve meeting. Traders estimate the likelihood of the Fed maintaining the current rate range at the 18 March meeting at 98%. This figure has changed little from previous calculations, reflecting stable expectations of a pause in monetary policy.
Additional pressure on the dollar came from oil inventory data. US commercial crude oil inventories for the week ending 20 February rose by 15.989 million barrels, marking the sharpest increase since February 2023. Analysts had expected a rise of only 1.8 million barrels, which increased doubts about demand sustainability and added volatility to the currency market.
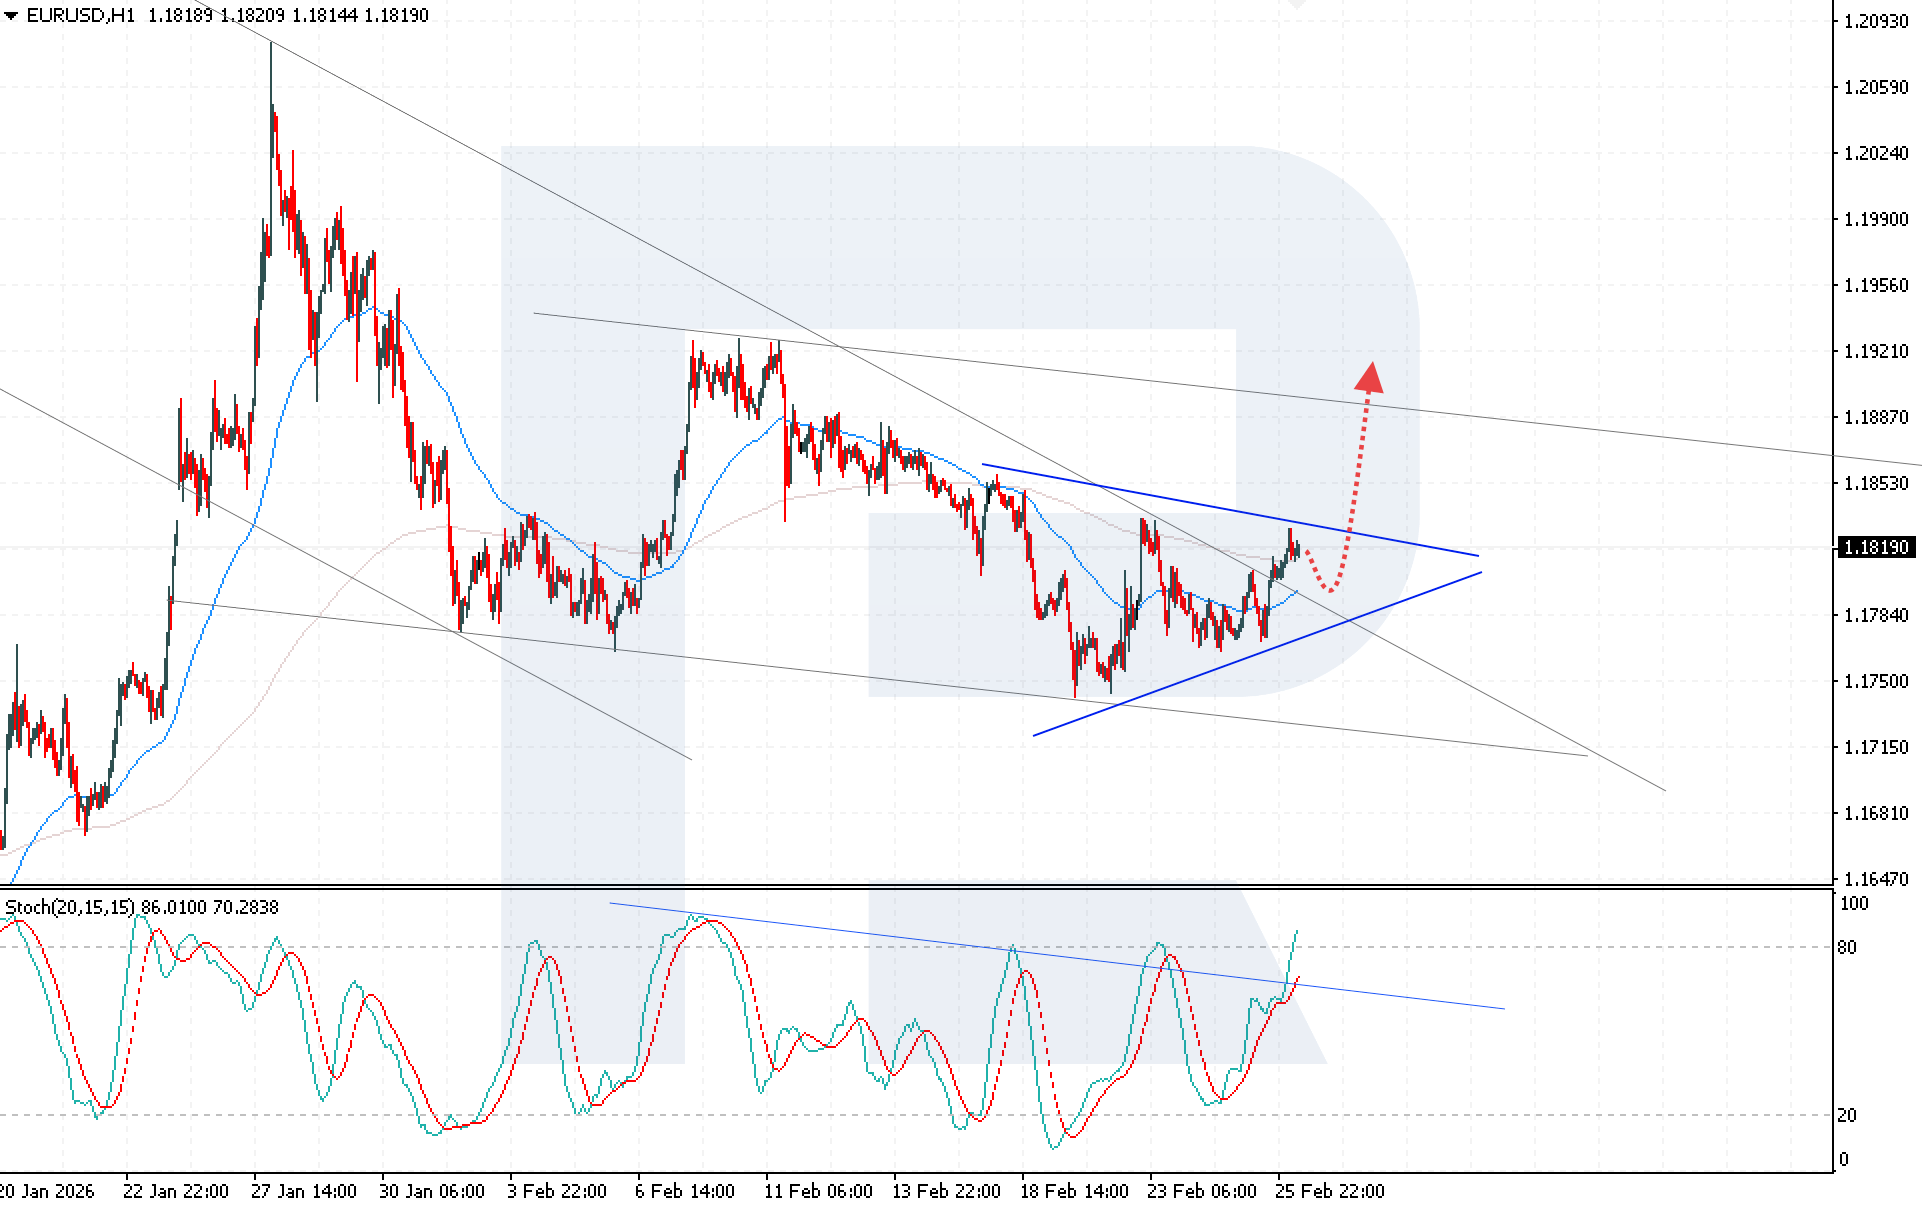
Technical outlook
The EURUSD pair is testing the upper boundary of the Triangle pattern, with buyers holding above the EMA-285, indicating growing bullish pressure despite the previously formed downward impulse.
Today’s EURUSD forecast suggests continued growth towards 1.1920. The technical picture remains positive for buyers. The Stochastic Oscillator supports this scenario, as its values have consolidated above the descending trendline, signalling sustained upward potential. A breakout above the upper boundary of the Triangle pattern and consolidation above 1.1835 would confirm the main scenario. In this case, the market will receive an additional technical signal for a sustained upward movement.
The alternative scenario will unfold if the price breaks below the lower boundary of the Triangle pattern and consolidates below 1.1765. Such a signal would indicate weakening bullish positions and open the way for a deeper correction.
EURUSD overview
- Asset: EURUSD
- Timeframe: H1 (Intraday)
- Trend: upward
- Key resistance levels: 1.1840 and 1.1920
- Key support levels: 1.1785 and 1.1680
EURUSD trading scenarios for today
Main scenario (Buy Stop)
A breakout above the upper boundary of the Triangle pattern with consolidation above 1.1840 would create conditions for opening long positions. The potential movement is about 80 pips with a risk of 35 pips, resulting in a risk-to-reward ratio of approximately 1:2.
- Take Profit: 1.1920
- Stop Loss: 1.1805
Alternative scenario (Sell Stop)
Consolidation below 1.1770 would indicate a breakout below the lower boundary of the Triangle pattern and may trigger a deeper decline.
- Take Profit: 1.1680
- Stop Loss: 1.1805
Risk factors
Risks to the bullish scenario will increase if the price breaks below the lower boundary of the Triangle pattern and consolidates below 1.1765, potentially triggering profit-taking and selling pressure. An additional negative factor could be unexpectedly strong US macroeconomic data, which would support the dollar and limit the EURUSD’s upside potential.
Summary
Soft expectations regarding Federal Reserve rates and growing trade uncertainty are keeping the dollar under pressure, allowing the EURUSD rate to maintain its elevated positions after the recent upward momentum. Technical analysis indicates that the upward scenario remains the priority, with a target at 1.1920.
Editors’ picks
 EURUSD 2026-2027 forecast: key market trends and future predictions
This article provides the EURUSD forecast for 2026 and 2027 and highlights the main factors determining the direction of the pair’s movements. We will apply technical analysis, take into account the opinions of leading experts, large banks, and financial institutions, and study AI-based forecasts. This comprehensive insight into EURUSD predictions should help investors and traders make informed decisions.
 Gold (XAUUSD) forecast 2026 and beyond: expert insights, price predictions, and analysis
Dive deep into the Gold (XAUUSD) price outlook for 2026 and beyond, combining technical analysis, expert forecasts, and key macroeconomic factors. It explains the drivers behind gold’s recent surge, explores potential scenarios including a move toward 4,500 to 5,000 USD per ounce, and highlights why the metal remains a strong hedge during global uncertainty.
Forecasts presented in this section only reflect the author’s private opinion and should not be considered as guidance for trading. RoboForex bears no responsibility for trading results based on trading recommendations described in these analytical reviews.