Nike: Q2 2026 Earnings Review, Business Evaluation and Stock Forecast for 2026
Nike exceeded expectations for revenue and EPS in Q2 of the 2026 fiscal year, but faced a sharp decline in margin and profit. This article covers the fundamental and technical analysis of NKE and potential stock price scenarios in 2026.
In Q2 of the 2026 fiscal year, which ended on 30 November 2025, Nike, Inc. (NYSE: NKE) reported revenue of 12.427 billion USD, up 1% year-over-year, and diluted EPS of 0.53 USD, which was 32% lower than the previous year. The market had expected about 12.22 billion USD in revenue and 0.38 USD in earnings per share, so the report beat expectations on both metrics. However, profitability significantly deteriorated. Gross margin dropped to 40.6%, which is 300 basis points lower than last year. Non-GAAP net income fell to 0.99 billion USD, a 29% year-over-year decline, and operating margin decreased to 8.0%.
Revenue growth came from the wholesale channel. Wholesale revenue rose by 8% to 7.5 billion USD. At the same time, sales through NIKE Direct fell by 9%, and in the Greater China region, sales dropped by 16%, worsening the overall business dynamics.
The outlook for Q3 of the 2026 fiscal year is cautious. The company expects revenue to decline by low single digits, gross margin to deteriorate by 175 – 225 basis points, and operating expenses including marketing and administrative costs to rise by several percent. This suggests additional profit pressure in the upcoming quarter. Management specifically noted that tariffs are increasing costs and estimates their negative impact at 1.5 billion USD annually.
This article reviews Nike, Inc., outlines its revenue sources, summarises Nike’s quarterly performance, and presents expectations for Q3 of the 2026 fiscal year. Additionally, a technical analysis of NKE is provided, which forms the basis for the Nike stock forecast for the 2026 calendar year.
About Nike, Inc.
Nike, Inc. is a US-based company founded on 25 January 1964 by Phil Knight and Bill Bowerman under the name Blue Ribbon Sports before rebranding as Nike in 1971. The company designs, manufactures, markets, and sells athletic footwear, apparel, accessories, and equipment. Its primary business segment is athletic footwear, which generates most of its revenue. Nike produces goods for a variety of sports, including running, basketball, football, tennis, golf, and fitness.
The company was listed on the NYSE on 2 December 1980 under the ticker symbol NKE.

Nike, Inc.’s main revenue streams
Nike’s revenue is generated from various sources within its business operations, with a primary focus on key areas such as footwear, apparel, and equipment, as well as brand licensing and digital platforms. Nike’s main revenue streams are outlined below:
- Footwear sales : Nike’s largest source of revenue is footwear, including athletic sneakers, casual shoes, and specialised models for running, basketball, and fitness. In Q3 fiscal 2025, footwear remained the dominant category; however, quarterly data show a revenue decline in this segment, highlighting challenges linked to excess inventory and competitive pressures
- Apparel sales : this category encompasses sports and casual apparel, including T-shirts, shorts, tank tops, and outerwear. Apparel complements Nike’s footwear range and is a significant revenue stream, often related to seasonal demand and collaborations with sports companies
- Sports equipment sales : Nike generates revenue from sports equipment, including bags, socks, gloves, and accessories. While smaller than the footwear and apparel segments, this category plays a supporting role in the brand’s ecosystem
- Nike Direct : revenue from direct-to-consumer sales –
including Nike’s website, mobile app, and physical stores –
falls under the Nike Direct segment. This channel prioritises direct sales to consumers, bypassing wholesalers. Digital sales remain a key focus for Nike, with continued investment in e-commerce
Nike, Inc. Q3 FY2025 report
On 20 March, Nike released its earnings report for Q3 of fiscal year 2025, which ended on 28 February. Below are the key financial figures compared to the same period last year:
- Revenue : 11.27 billion USD (-9%)
- Net income : 0.79 billion USD (-32%)
- Earnings per share : 0.54 USD (-30%)
- Gross margin : 41.5% (-330 basis points)
Revenue by country:
- North America : 4.86 billion USD (-4%)
- Europe, Middle East, and Africa : 2.81 billion USD (-10%)
- Greater China : 1.73 billion USD (-17%)
- Asia Pacific and Latin America : 1.47 billion USD (-11%)
The company’s management attributed a 9% decline in revenue to a double-digit drop in sales in January and February, following a successful holiday season in December. China experienced the most significant slump, with sales falling by 17%. Despite growth in the workout and running apparel categories, Nike noted a decline in the sports style and Jordan brand segments, particularly in its classic footwear lines.
Nike’s management forecast a substantial revenue decline of 13.0-15.0% in Q4 of fiscal year 2025, ending on 31 May 2025, which exceeded analysts’ forecasts of 11.4-12.2%. The outlook reflected efforts to liquidate excess inventory and refresh outdated product lines amid external factors such as tariffs and economic uncertainty.
CFO Matthew Friend expected gross margin to decrease by 4-5 percentage points due to the active sell-off of old inventory and the introduction of new, innovative models, noting that Q4 fiscal 2025 would be the period with the most significant impact from these measures, after which pressure on revenue and margins was expected to ease in fiscal 2026.
Overall, Nike’s management described the quarter as a period of progress amid ongoing challenges, exceeding income expectations while continuing to face pressure on revenue and margins. For the upcoming quarter, they forecast a more substantial decline in sales and margins as part of a strategic business relaunch, with hopes for improvements in the fiscal year 2026.
Nike, Inc. Q4 2025 financial report
On 26 June, Nike released its Q4 2025 financial results for the period ending 31 May. Key financial figures compared with the same period last year are as follows:
- Revenue : 11.10 billion USD (-12%)
- Net profit : 0.21 billion USD (-86%)
- Earnings per share : 0.14 USD (-86%)
- Gross margin : 40.3% (-440 basis points)
Revenue by country:
- North America : 4.70 billion USD (-11%)
- Europe, Middle East & Africa : 3.00 billion USD (-9%)
- Greater China : 1.48 billion USD (-21%)
- Asia Pacific & Latin America : 1.58 billion USD (-8%)
Nike’s Q4 2025 report served as an indicator of a transitional phase in the company’s strategy. Despite weak financial results, management demonstrated confidence in the beginning of a recovery cycle. Revenue declined by 12% to 11.1 billion USD, and earnings per share fell by 86% to 0.14 USD. However, both figures exceeded market expectations and were positively received by investors.
Management identified Q4 as the low point in the implementation of the ‘Win Now’ transformation program. Inventory levels continued to decline, the retreat from aggressive discounting was underway, and the product portfolio was being reshaped with a focus on core sports categories. Under the leadership of new CEO Elliott Hill, management took steps to strengthen the brand’s position in key segments and reallocate internal resources.
The market responded to the report with a 14% rise in Nike shares. Analysts at JPMorgan, HSBC, Jefferies, and other investment houses raised their price targets, citing signs of a sustainable business turnaround.
For Q1 2026, Nike projected a mid-single-digit percentage decline in revenue, which represented an improvement on previous market estimates. At the same time, the company anticipated gross margin compression of 350–425 basis points, driven by tariff costs and changes in the sales mix. According to CFO Matt Friend, Nike was prepared to offset up to 1 billion USD in additional tariffs by shifting some production out of China and introducing moderate price increases in the US, starting in autumn.
The restructuring strategy included personnel changes, a refocus on key product lines, optimisation of sales channels, and a return to a more sustainable distributor engagement model. The stabilisation of inventory levels (at approximately 7.5 billion USD) and growing interest in new collections confirmed positive momentum.
Despite continued revenue pressure in several regions (notably a 11% decline in North America and a 21% decline in China), the company was laying the groundwork for a gradual recovery in operational efficiency. With external risks easing and the planned initiatives being successfully implemented, Nike’s medium-term share price outlook was assessed as positive.
Nike, Inc. Q1 FY2026 report
On 30 September, Nike released its financial results for Q1 FY2026, covering the period ended on 31 August. The key financial indicators, compared with the same period of the previous year, are as follows:
- Revenue : 11.72 billion USD (+1%)
- Net profit : 0.72 billion USD (–31%)
- Earnings per share (EPS) : 0.49 USD (–30%)
- Gross margin : 42.2% (–320 basis points)
Revenue by region:
- North America : 5.02 billion USD (+4%)
- Europe, Middle East & Africa : 3.33 billion USD (+6%)
- Greater China : 1.51 billion USD (–9%)
- Asia Pacific & Latin America : 1.49 billion USD (+2%)
Nike’s quarterly report exceeded analyst expectations. Revenue totalled 11.72 billion USD, up 1% year-on-year and well above the expert forecast of 11.0 billion USD. Adjusted EPS came in at 0.49 USD, nearly double the expected 0.27 USD.
The stronger performance was driven primarily by wholesale sales growth and recovering demand in North America. Products in the running, training, and basketball categories performed particularly well. However, NIKE Direct sales fell 4% year-on-year, while digital channel sales dropped 12%. In China, demand remained weak, with no signs of improvement so far. Gross margin also declined to 42.2%, down 3.2 percentage points from the previous year, due to higher discounting, changes in channel mix, and rising costs, including customs tariffs. As a result, profitability declined, despite the strong figures for revenue and earnings per share.
For the upcoming quarter, Nike issued cautious guidance. The company expects revenue to fall by a few percentage points and gross margin to contract further by 3.0–3.75 percentage points, partly due to tariffs. Operating expenses (SG&A) in absolute terms are expected to continue rising, while the effective tax rate will be slightly above 20%. According to management, direct sales through Nike’s own channels are not expected to return to growth over the course of FY2026.
Nike, Inc. Q2 2026 Fiscal Year Report
On 30 September, Nike released its Q2 2026 fiscal year report, ending 30 November. Below are the key financial metrics compared to the same period last year:
- Revenue : 12.43 billion USD (+1%)
- Net profit (non-GAAP) : 0.99 billion USD (-29%)
- Earnings per share (non-GAAP) : 0.53 USD (-32%)
- Gross margin : 40.6% (-300 basis points)
Revenue by country:
- North America : 5.63 billion USD (+9%)
- Europe, Middle East & Africa : 3.39 billion USD (-1%)
- Greater China : 1.42 billion USD (-16%)
- Asia Pacific & Latin America : 1.67 billion USD (-4%)
In Q2 2026, which ended on 30 November 2025, Nike’s revenue came in slightly above market expectations, but profit quality remained weak. Revenue stood at 12.43 billion USD, rising 1% year-over-year and exceeding the consensus. EPS reached 0.53 USD, also ahead of analysts' estimates.
The main issue of the quarter was a sharp drop in profitability. Gross margin declined to 40.6%, down 3 percentage points from last year. Net profit fell by 32% to 792 million USD. According to the company’s non-GAAP data, operating profit dropped by nearly one-third, and operating margin fell to 8.0% from 11.3% the previous year.
Sales structure shifted towards wholesale. The wholesale channel grew 8%, generating 7.5 billion USD in revenue—but this is a lower-margin business. NIKE Direct sales fell by 8%, with digital sales down 14% and branded stores down 3%. This suggests that the primary high-margin revenue source has not recovered, and revenue growth is being driven by the less profitable channel.
Additional pressure came from regional dynamics. In Greater China, operating profit was nearly halved, and China continued to significantly drag down overall results. North America fared better, but still saw lower operating profit compared to last year.
The company directly explained margin decline reasons. Results were heavily affected by higher tariffs in North America, clearance sales to empty inventories, and restructuring of the product range and sales channels. At the same time, Nike increased marketing expenses by 13%. The CFO clarified that new tariffs add about 1.5 billion USD in annual costs, creating serious pressure on gross margin, which will not fully disappear in the coming quarters.
The forecast for Q3 2026 remains cautious. The company expects revenue to drop by low single digits, continued pressure on gross margin, and increased expenses due to marketing and investments.
Overall, Nike continues to perform better than market expectations on revenue, but margin and operating profit are deteriorating, and the company pre-warns of a challenging upcoming quarter due to tariffs and ongoing business restructuring.
Fundamental analysis of Nike, Inc.
Below is the fundamental analysis of NKE based on the results of Q2 2026 fiscal year:
- Liquidity and Debt : As of 30 November 2025, Nike had 6.97 billion USD in cash and 1.37 billion USD in short-term investments. In total, this equals 8.35 billion USD in liquid assets. Current assets amounted to 24.02 billion USD versus current liabilities of 11.64 billion USD. This corresponds to a current ratio of around 2.1.
Debt load decreased over the year. Long-term debt dropped to 7.02 billion USD, down 12% from a year ago. Comparing debt to cash and short-term investments, the company is close to a net cash position. Liquidity exceeds debt by 0.33 billion USD. However, lease obligations must also be considered. Short-term lease liabilities are 0.51 billion USD, and long-term leases total 2.75 billion USD.
- Cash Flow : The company stated that operating cash flow remains stable, although total liquidity decreased by about 1.4 billion USD over the year. The decline was linked to dividends, bond repayments, share buybacks, and capital expenditures. This indicates that cash was spent on reducing debt and returning capital to shareholders—not on covering operational issues. The company paid approximately 598 million USD in dividends during the quarter.
- Profitability and Earnings Quality : In Q2 2026, revenue grew by 1%, but profitability significantly deteriorated. Gross margin dropped to 40.6%. Non-GAAP operating margin fell to 8.0% from 11.3% a year earlier. Net profit declined by 29%, and EPS stood at 0.53 USD. The key issue for the quarter was margin pressure despite almost unchanged revenue. Marketing and demand-support expenses increased, and the gross margin drop directly impacted profit and reduced financial resilience.
Conclusion on Fundamental Analysis of NKE:
Nike maintains a strong balance sheet and normal short-term solvency in Q2 2026, and the company is not overleveraged. However, the main problem in the quarter is the decline in margin and profit while revenue grew only 1%. This reduces the safety margin and makes the results more sensitive to tariffs, discounts, and sales structure. From a stability standpoint, this is not a crisis, but a clear deterioration in operational performance.
Analysis of key Nike, Inc. multiples
Below are the key Nike, Inc. multiples for Q2 2026 fiscal year, calculated at a share price of 59 USD.
| Multiple | What it indicates | Value | Comment |
|---|---|---|---|
| P/E (TTM) | Price paid for 1 USD of earnings over the past 12 months | 35 | ⬤ Stock is expensive based on earnings: investors pay over 30 years of profit while margin is already under pressure |
| P/S (TTM) | Price paid for 1 USD of annual revenue | 1.9 | ⬤Average valuation based on revenue |
| EV/Sales (TTM) | Enterprise value to sales, accounting for debt | 1.8 | ⬤ Very close to P/S due to net cash. Normal level for a global brand |
| P/FCF (TTM) | Price paid for 1 USD of free cash flow | 31 | ⬤ Assuming FCF around 6% of revenue, Nike looks fairly expensive on cash |
| FCF Yield (TTM) | Free cash flow yield to shareholders | 3% | ⬤ Free cash flow yield is low |
| EV/EBITDA (TTM) | Enterprise value to operating profit before depreciation and amortisation | 22 | ⬤ High multiple for a large consumer brand |
| EV/EBIT (TTM) | Enterprise value to operating profit | 26 | ⬤ Same story as EBIT: operating profit is expensive, with limited valuation cushion |
| P/B | Price to book value | 6.2 | ⬤ Significant premium to book value, but not unusual for a brand with strong intangibles |
| Net Debt/EBITDA | Debt burden relative to EBITDA | -0.3 | ⬤ Balance sheet has net cash, not net debt |
| Interest Coverage (TTM) | Ability to cover interest expenses with operating profit | 9 | ⬤ Debt interest covered with strong buffer, even amid weaker profitability |
Conclusion on NKE Valuation:
Financially, Nike remains resilient. The company holds net cash, moderate debt load, and a profitable business—even in a weak quarter. However, at the current price of around 59 USD, the stock appears expensive. Multiples are high: P/E ~35, EV/EBITDA above 20, P/FCF - 31. This means the market has already priced in margin recovery and a return to confident growth. Buying NKE stock only makes sense if one believes the current issues with China, tariffs, and margin are temporary and the company can return to higher profitability and strong free cash flow in the coming years.
Expert forecasts for Nike, Inc. stock
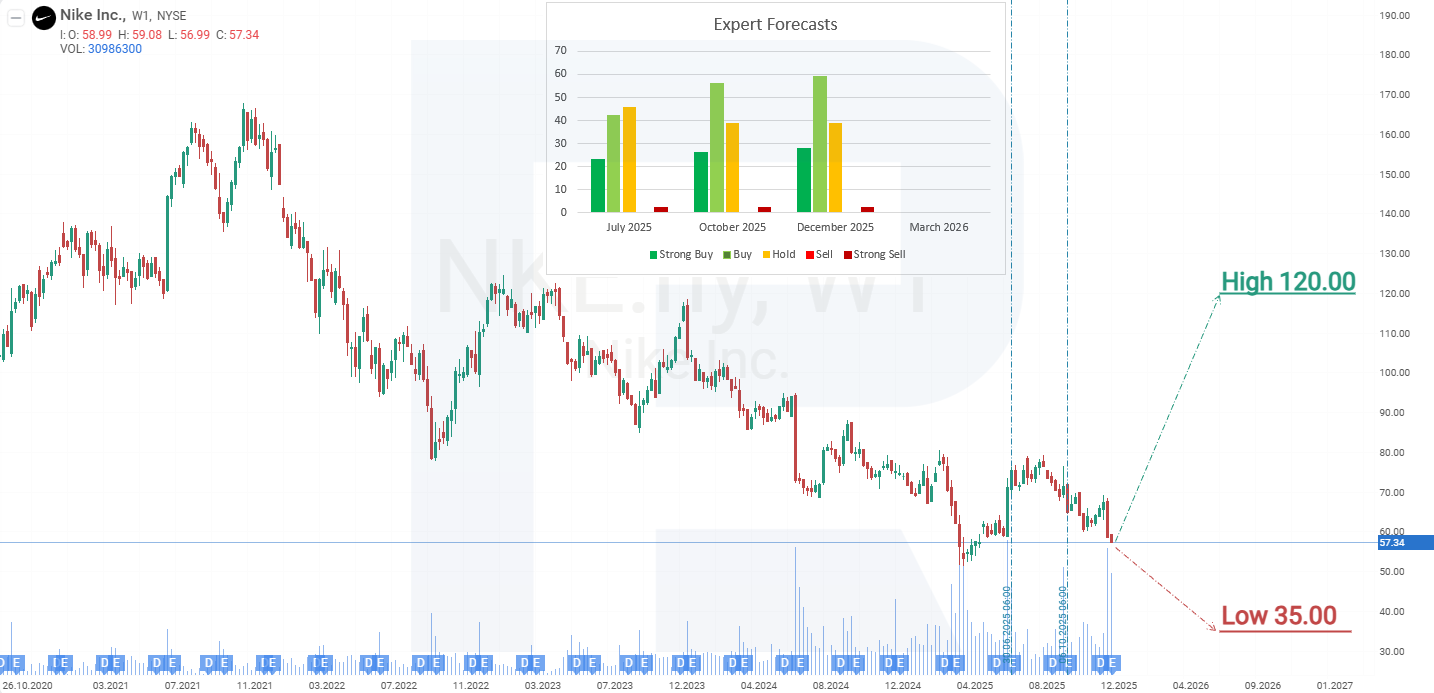
- Barchart : 17 out of 35 analysts rated Nike stock as Strong Buy, 4 as Moderate Buy, 12 as Hold, and 2 as Strong Sell. The upper bound of the forecast reaches 120 USD, the lower bound – 35 USD.
- MarketBeat : 27 out of 37 experts gave the stock a Buy rating, and 10 gave a Hold recommendation. The upper bound of the forecast reaches 115 USD, the lower bound – 62 USD.
- TipRanks : 20 out of 29 respondents rated the stock as Buy, and 9 gave a Hold recommendation. The upper bound of the forecast reaches 120 USD, the lower bound – 62 USD.
- Stock Analysis : 11 out of 27 experts rated the stock as Strong Buy, 8 as Buy, and 8 as Hold. The upper bound of the forecast reaches 115 USD, the lower bound – 62 USD.
Nike, Inc. stock price forecast for 2026
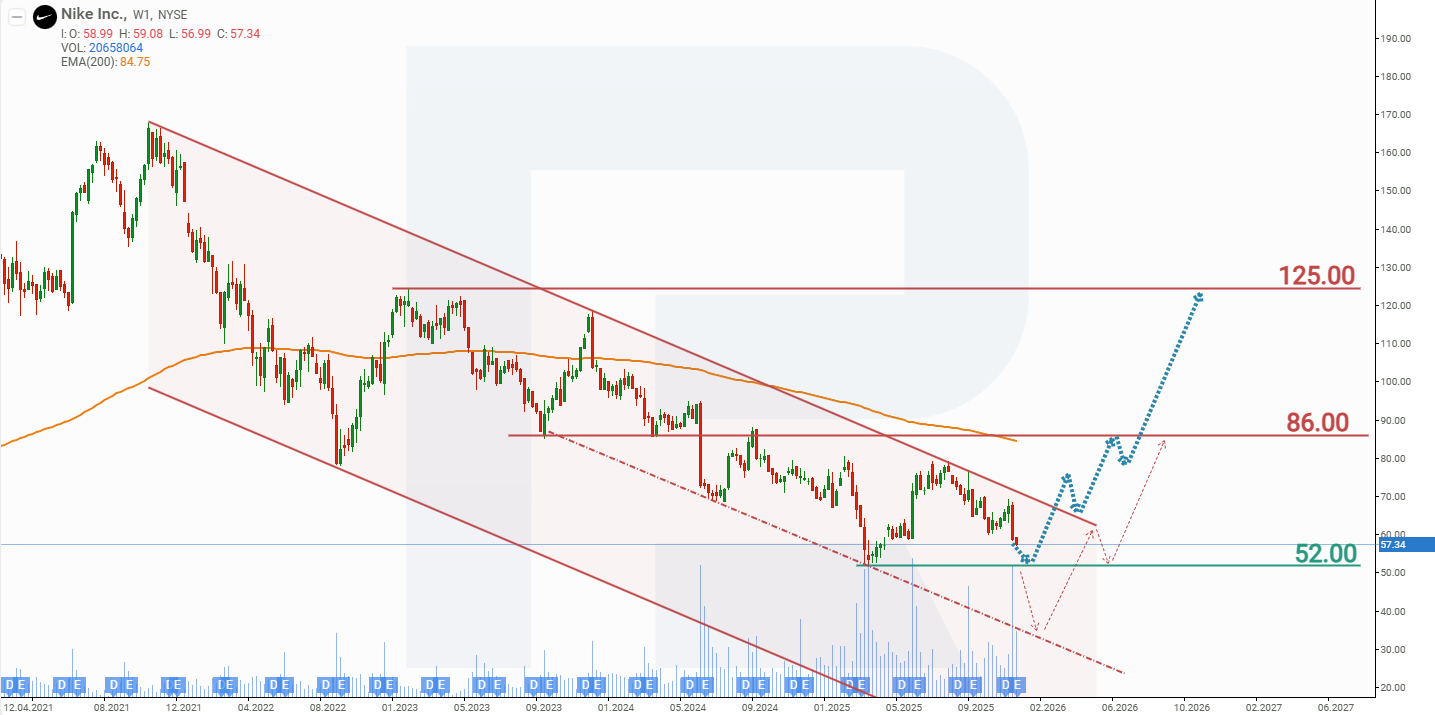
On the weekly timeframe since November 2021, Nike stock has been trading within a descending channel. Over the last four quarters, company profits have not shown year-over-year growth—in fact, margins have gradually continued to decline. These factors are pressuring the stock, causing NKE prices to once again approach the 52 USD support level, which corresponds to the lowest prices in the past seven years.
On the positive side, the company maintains a solid financial position, allowing it to weather the current difficult period without threatening its business stability. Based on current dynamics, here are possible scenarios for NKE’s stock movement in 2026:
Main Forecast:
Nike stock is expected to rebound from the 52 USD support and rise to the resistance at 86 USD. If this scenario plays out, the descending trendline will be broken, indicating an end to the downward trend and a potential shift to an upward trend. A breakout above the 86 USD resistance could open the path for further stock growth toward 125 USD.
Alternative Forecast:
The alternative scenario envisions a breakdown below the 52 USD support. In this case, NKE stock may decline to the next support level around 30 USD, where a rebound and recovery to 86 USD are expected. The 30 USD level could be attractive to dividend-oriented investors, as the yield would exceed 5.3% annually if current payouts are maintained.
Risks of investing in Nike, Inc. stock
When investing in Nike, it is crucial to consider the risks that may negatively impact the company’s income and affect its investors. The main risks are outlined below:
- The impact of tariffs on profit margins : Nike has warned that higher tariffs on imports from China and Mexico could significantly reduce profit margins
- Competition and loss of market share : Nike faces intense competition from brands such as New Balance and Adidas, which are strengthening their positions, particularly in casual footwear and retro model segments. This poses a threat to Nike’s market share
- Economic instability : factors such as inflation, recession fears, and reduced purchasing power may lead to decreased consumer spending on sportswear and footwear, ultimately impacting Nike’s revenues
Forecasts presented in this section only reflect the author’s private opinion and should not be considered as guidance for trading. RoboForex bears no responsibility for trading results based on trading recommendations described in these analytical reviews.