Home Depot – financial resilience, risks, and stock valuation for 2026
Home Depot shares remain resilient but lack a clear growth catalyst amid weak demand and cautious management guidance. This article presents a fundamental analysis of HD and outlines key price levels for the 2026 calendar year.
The Home Depot, Inc. (NYSE: HD) reported revenue of 41.35 billion USD for Q3 of the 2025 financial year, representing year-on-year growth of 2.8%. Non-GAAP earnings per share amounted to 3.74 USD, operating profit reached 5.51 billion USD, and operating margin stood at 13.3%.
Demand during the quarter remained weak. Comparable sales increased by just 0.2%, while comparable transactions declined by 1.6%. Management explicitly noted that results fell short of expectations due to the absence of storm-related demand and the failure of the anticipated recovery in customer activity to materialise.
The company revised its full-year 2025 financial guidance in a more cautious direction. Home Depot now expects sales growth of around 3%, including a contribution of approximately 2.0 billion USD from GMS, slightly positive comparable sales growth, an operating margin of around 13.0%, and a decline in non-GAAP earnings per share of approximately 5% compared with 2024, when EPS amounted to 15.24 USD.
For the upcoming quarter, the company does not anticipate any meaningful improvement. Management expects demand pressure to persist due to limited storm-related activity, ongoing consumer uncertainty, and continued headwinds from the housing market.
This article examines The Home Depot, Inc., outlines the sources of its revenue, summarises the company’s quarterly performance, and presents expectations for the next reporting period. It also includes a technical analysis of HD shares, on the basis of which a forecast for Home Depot stock for the 2026 calendar year is developed.
About The Home Depot, Inc.
The Home Depot, Inc. is the largest home improvement and construction retail chain in the US. The company was founded in 1978 by entrepreneurs Bernard Marcus, Arthur Blank, Ron Brill, and Pat Farrah in Atlanta, Georgia. Home Depot went public in 1981, listing on the New York Stock Exchange under the ticker HD.
Its core business involves the sale of building materials, tools, renovation supplies, gardening products, and home improvement goods, as well as related services for both private and commercial customers.
Key competitors include Lowe’s, Walmart (NYSE: WMT), Menards, and online retailer Amazon in the home improvement and DIY categories.

Key cash flow streams for The Home Depot, Inc.
Home Depot’s business model is built around the sale of products and services related to home improvement, construction, and renovation. The company’s revenue is generated from the following key components:
- Retail product sales: this segment is the company’s primary source of revenue, encompassing the sale of building materials, tools, plumbing supplies, lighting fixtures, flooring, furniture, appliances, and gardening equipment.
- E-commerce: Home Depot continues to expand its online presence. Revenue is generated through direct online orders as well as ‘buy online, pick up in store’ (BOPIS) and home delivery models.
- Installation and repair services: the company offers paid services, including kitchen, flooring, door and window installation, appliance setup, and home repairs.
- Professional customer (Pro Business) sales: a significant portion of revenue comes from Pro customers – building contractors, tradespeople, and organisations that regularly purchase large volumes of materials and tools.
- Financial and related services: additional income is generated through financing solutions, gift cards, loyalty programs, equipment rentals, and value-added services designed to support home improvement and construction projects.
Home Depot’s business model combines mass retail with tailored services for both DIY consumers and professionals, leveraging a broad product range, in-store services, and digital channels to drive sustainable revenue growth.
The Home Depot, Inc. Q1 2025 financial results
On 20 May, Home Depot released its Q1 2025 results for the 2025 financial year, which covered the period ended 4 May. The key figures compared with the same period last year are as follows:
- Revenue: 39.86 billion USD (+9%)
- Net profit: 3.43 billion USD (–32%)
- Earnings per share: 3.56 USD (–30%)
- Operating margin: 13.2% (–90 basis points)
Home Depot’s Q1 FY2025 report showed continued revenue growth of 9.4% year-on-year, reaching 39.9 billion USD, slightly ahead of analysts’ expectations. This performance reflects stable customer activity (nearly 395 million transactions), even as the average transaction value remained flat. Comparable sales declined by 0.3% overall due to currency fluctuations; however, a 0.2% increase in the US highlights the resilience of its core domestic market. Adjusted earnings per share came in at 3.56 USD, slightly below expectations, breaking a multi-quarter run of upside surprises – although the miss was marginal.
During the earnings call, management emphasised a measured and strategic approach. Despite the introduction of new tariffs, Home Depot chose not to pass additional costs on to consumers by raising prices across a broad range of products. This was made possible by its diversified supply chain, with approximately half of its inventory sourced domestically and no single foreign country accounting for more than 10%. As a result, the company opted to absorb the additional expenses itself, helping to preserve its competitive positioning – in contrast to competitors such as Walmart, which has signalled plans to increase prices for consumers.
The company reaffirmed its full-year guidance, forecasting revenue growth of approximately 2.8%, comparable sales growth of around 1%, and a decline in adjusted EPS of roughly 2%. The outlook for Q2 was also described as stable, although management pointed to ongoing pressure from elevated interest rates, which continue to weigh on demand for larger-scale projects.
For investors, the past quarter offered several encouraging signals: revenue growth was driven by smaller projects, pricing discipline remains intact, market share appears well-protected, and full-year targets were reaffirmed. Yes, the drop in EPS and macroeconomic risks, such as a strong US dollar and cautious consumer sentiment, suggest a more moderate near-term trajectory. Even so, the Q2 guidance supports confidence in the outlook, backed by modest sales growth expectations and steady performance in the US. Overall, for those seeking a defensive position in the consumer sector with strong margins and robust pricing discipline, Home Depot shares are an attractive option.
The Home Depot, Inc. Q2 2025 financial results
On 29 August, Home Depot released its Q2 results for the 2025 financial year, covering the period ended 3 August. The key financial indicators compared with the same period of the previous year were as follows:
- Revenue: 45.28 billion USD (+4.9%)
- Net profit (non-GAAP): 4.65 billion USD (+0.4%)
- Earnings per share (EPS): 4.68 USD (+0.2%)
- Operating margin: 14.8% (–50 basis points)
Home Depot reported year-on-year revenue growth of 5% in Q2 2025, with revenue reaching 45.3 billion USD. Adjusted earnings per share came in at 4.68 USD, slightly below analyst expectations. During this quarter, the average ticket size increased, though in-store traffic declined slightly. Strong sales were recorded in high-value purchases exceeding 1,000 USD, cordless power tools, home appliances, and storage products. Online sales grew by 12%, and both professional and retail customers increased their spending.
Challenges included subdued demand for large-scale renovation projects, slower inventory turnover, and minor pressure from exchange-rate fluctuations. Despite these challenges, the company continued to invest in business development and pay dividends, allocating around 3.2 billion USD in total during the quarter. Return on invested capital for the year declined from 31.9% to 27.2%.
Management reaffirmed its full-year outlook, expecting sales growth of 2.8% and stable profitability, while earnings per share were expected to be around 2% lower than in 2024.
The Home Depot, Inc. Q3 2025 financial results
On 18 November, Home Depot released its Q3 results for the 2025 financial year, which ended on 2 November. Key financial figures compared with the same period last year are as follows:
- Revenue: 41.35 billion USD (+3%)
- Net profit (non-GAAP): 3.72 billion USD (–1%)
- Earnings per share: 3.74 USD (–1%)
- Operating margin: 13.3% (–50 basis points)
The Home Depot delivered mixed results in Q3 of the 2025 financial year. Revenue increased to 41.35 billion USD, up 2.8% year-on-year, but profitability based on key non-GAAP metrics fell short of expectations. Adjusted operating profit amounted to 5.51 billion USD, operating margin declined to 13.3% from 13.8% a year earlier, and earnings per share fell to 3.74 USD from 3.78 USD in the prior year.
Operating performance appeared sluggish. Comparable sales increased by just 0.2%, the number of transactions declined by 1.4%, and revenue growth was driven mainly by an increase in the average transaction value to 90.39 USD, up 2.0% year-on-year. Management attributed the weak performance to lower demand related to weather events during the quarter, as well as broader consumer uncertainty and ongoing pressure from the housing market. Revenue also included approximately 0.9 billion USD from the GMS acquisition.
The company revised its outlook for the full 2025 financial year, which ends in February 2026, in a more cautious direction. Home Depot now expects sales growth of around 3%, slightly positive comparable sales, an operating margin of approximately 13.0%, and a 5% decline in adjusted earnings per share compared with 2024, when EPS amounted to 15.24 USD. In effect, management acknowledged that the earnings trajectory will be weaker than previously anticipated, as earlier guidance had assumed a more moderate decline.
Fundamental analysis of The Home Depot, Inc.
Below is a fundamental analysis for HD based on the results of the Q1 2026 financial year:
- Liquidity and debt: at the end of the quarter, Home Depot held 1.68 billion USD in cash. Current assets totalled 36.11 billion USD, while current liabilities stood at 34.37 billion USD. This indicates a limited working capital buffer, which is largely dependent on inventories, valued at 26.20 billion USD. The cash cushion is relatively small, and the company relies actively on short-term financing. Short-term debt in the form of commercial paper totals 3.20 billion USD, while the commercial paper programme limit has been increased to 11.00 billion USD and is fully backed by committed credit facilities of the same amount. Management explicitly states that the combination of operating cash flow, access to the commercial paper market, and long-term debt is sufficient to support operations and shareholder distributions. Total balance sheet debt stands at approximately 56.00 billion USD. Additionally, lease liabilities amount to 1.42 billion USD in the short term and 7.99 billion USD in the long term.
- Cash flows and free cash flow: over the first nine months of the 2025 financial year, operating cash flow totalled 12.98 billion USD, down from 15.14 billion USD a year earlier. The decline was attributed primarily to changes in working capital, notably higher inventory levels and shifts in supplier payments and tax settlements. Capital expenditure over this period amounted to 2.62 billion USD, resulting in free cash flow before acquisitions of approximately 10.40 billion USD. Dividends paid over the nine months totalled 6.86 billion USD. While dividends are formally covered by free cash flow, the margin of safety is limited, particularly given large acquisitions. This is evident in investment activity: spending on acquisitions totalled 5.25 billion USD, pushing total investment outflows to 7.77 billion USD and leading the company to rely more heavily on debt financing.
- Profitability and earnings quality: in the Q3 2025 financial year, revenue increased to 41.35 billion USD, but profitability declined slightly. Operating profit amounted to 5.35 billion USD, compared with 5.42 billion USD a year earlier, while adjusted operating margin fell from 13.8% to 13.3%. Importantly, revenue growth was largely non-organic. Comparable sales increased by just 0.2%, indicating that underlying demand was broadly flat, with acquisitions accounting for part of the growth. Interest expense remains manageable at present. Quarterly interest costs were 628 million USD against operating profit of 5.35 billion USD, implying interest coverage of approximately 8–9 times.
- Balance sheet strength: the balance sheet has become heavier following M&A activity. Total assets increased to 106.27 billion USD from 96.12 billion USD at the end of the 2024 financial year. Intangible assets rose notably: goodwill increased to 22.27 billion USD, while other intangible assets reached 10.42 billion USD. This is typical for acquisition-driven growth, but it raises the risk of impairment if acquired businesses fail to deliver expected profitability. Liabilities remain high at 94.16 billion USD, while shareholders’ equity stands at 12.12 billion USD. Although equity increased year on year, the capital structure remains thin due to the large volume of share buybacks. The return on invested capital (ROIC) over the past twelve months declined to 26.3% from 31.5%, which management directly attributes to higher debt levels and a larger capital base following acquisitions.
Fundamental analysis for HD – conclusion.
Home Depot remains financially resilient, thanks to its large and stable operating cash flow and continued access to debt markets. However, balance sheet liquidity is limited and heavily tied to inventory levels, while debt and lease obligations are significant. Free cash flow before M&A broadly covers dividends, but once large acquisitions are factored in, the company becomes more dependent on borrowing. From an operating perspective, improvement remains limited: comparable sales are barely growing, margins have edged lower, and asset growth is being driven by acquisitions accompanied by rising goodwill and intangible assets.
Analysis of key valuation multiples for The Home Depot, Inc.
Below are the key valuation multiples for The Home Depot, Inc. based on the Q3 results of the 2025 financial year, calculated at a share price of 380 USD.
| Multiple | What it indicates | Value | Comment |
|---|---|---|---|
| P/E (TTM) | Price paid for 1 USD of earnings over the past 12 months | 26 | ⬤ For a mature retail business, this sits at the upper end of a comfortable valuation range. |
| P/S (TTM) | Price paid for 1 USD of annual revenue | 2.3 | ⬤ For a large retailer, this is moderately expensive: the business benefits from high turnover, but there is no clear buffer from revenue growth. |
| EV/Sales (TTM) | Enterprise value to sales, accounting for debt | 2.7 | ⬤ Given the substantial debt load, the business is valued at more than 2.5x revenue, which is a high level for a cyclical home improvement retailer. |
| P/FCF (TTM) | Price paid for 1 USD of free cash flow | 27 | ⬤ Based on free cash flow, the company appears expensive. |
| FCF Yield (TTM) | Free cash flow yield to shareholders | 3.7% | ⬤ The free cash flow yield is average. |
| EV/EBITDA (TTM) | Enterprise value to operating profit before depreciation and amortisation | 17.3 | ⬤ For a stable but cyclical retail business, this is a high multiple: the market is paying a significant premium for current profitability. |
| EV/EBIT (TTM) | Enterprise value to operating profit | 20.5 | ⬤ The valuation is highly sensitive to margins. Any deterioration in margins or demand may negatively affect the share price. |
| P/B | Price to book value | 31 | ⬤ On a book value basis, the shares look very expensive; however, it is important to note that equity has been depleted by share buybacks, making P/B less informative in this case. |
| Net Debt/EBITDA | Debt burden relative to EBITDA | 2.5 | ⬤ Debt is above the comfortable 1–2 range, but not yet critical. |
| Interest Coverage (TTM) | Ability to cover interest expenses with operating profit | 8.8 | ⬤ Interest expenses are covered with a solid buffer, and debt servicing risk remains low even if profits decline moderately. |
Valuation multiples analysis for Home Depot – conclusion
For a medium-term investor, Home Depot at a share price of 380 USD appears to be a high-quality defensive investment, but without a clear catalyst that would reliably drive the shares higher in the coming quarters. The business is resilient, cash flow remains strong, share buybacks support the share price, and the current debt load does not yet appear to pose a threat.
At the same time, operating momentum is close to stagnation, management has adopted a more cautious outlook, and the market is already pricing in a fairly optimistic scenario for margins and demand. As a result, over a 6–12 month horizon, upside potential will depend primarily on whether the housing and renovation markets begin to recover and whether comparable sales regain momentum.
If the macroeconomic backdrop improves and demand for home improvement accelerates, the shares could become attractive. However, if weak demand persists, the stock is more likely to trade sideways or come under pressure on negative news at the current valuation.
Expert forecasts for The Home Depot, Inc. stock
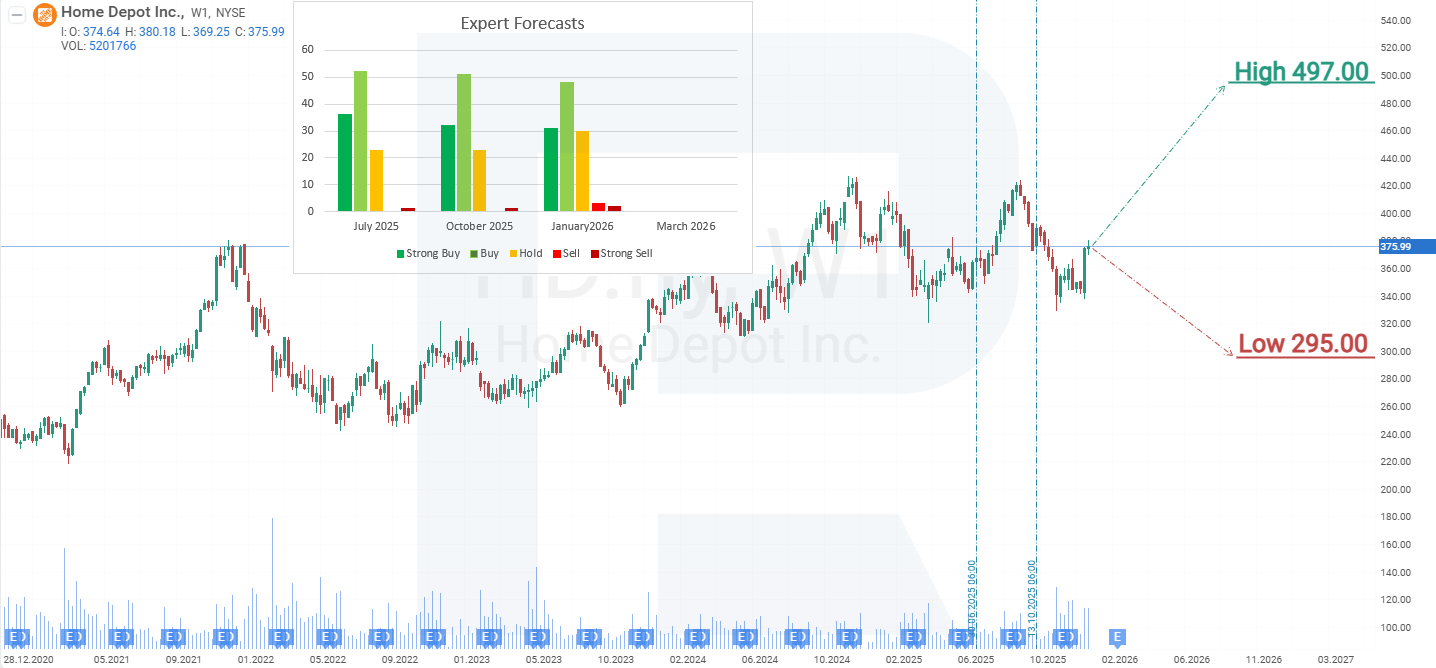
- Barchart: 22 of 35 analysts rated Home Depot shares as Strong Buy, 1 as Moderate Buy, 10 as Hold, and 2 as Strong Sell. The upper price target is 465 USD, and the lower bound is 295 USD.
- MarketBeat: 21 of 34 analysts assigned a Buy rating to the shares, 11 issued Hold recommendations, and 2 rated them Sell. The upper price target is 470 USD, and the lower bound is 320 USD.
- TipRanks: 17 of 23 surveyed analysts rated the shares as Buy, 5 issued Hold recommendations, and 1 rated them Sell. The upper price target is 441 USD, and the lower bound is 320 USD.
- Stock Analysis: 9 of 23 experts rated the shares as Strong Buy, 10 as Buy, and 4 as Hold. The upper price target is 497 USD, and the lower bound is 350 USD.
The Home Depot, Inc. stock price forecast for 2026
A few days after the quarterly report was released, Home Depot shares moved higher. Expectations of a potential reduction in the Federal Reserve’s key interest rate played a significant role. Some investors are hopeful that Trump could influence the Fed’s decisions. A rate cut could support the housing market, boosting Home Depot’s revenue and profitability. Another potential source of demand support is also being discussed: capping credit card interest rates at 10%. This would also be positive for Home Depot, as household spending on home improvements and renovations could be sustained at current levels. Based on the recent performance of Home Depot shares, the potential price scenarios for HD in 2026 are as follows:
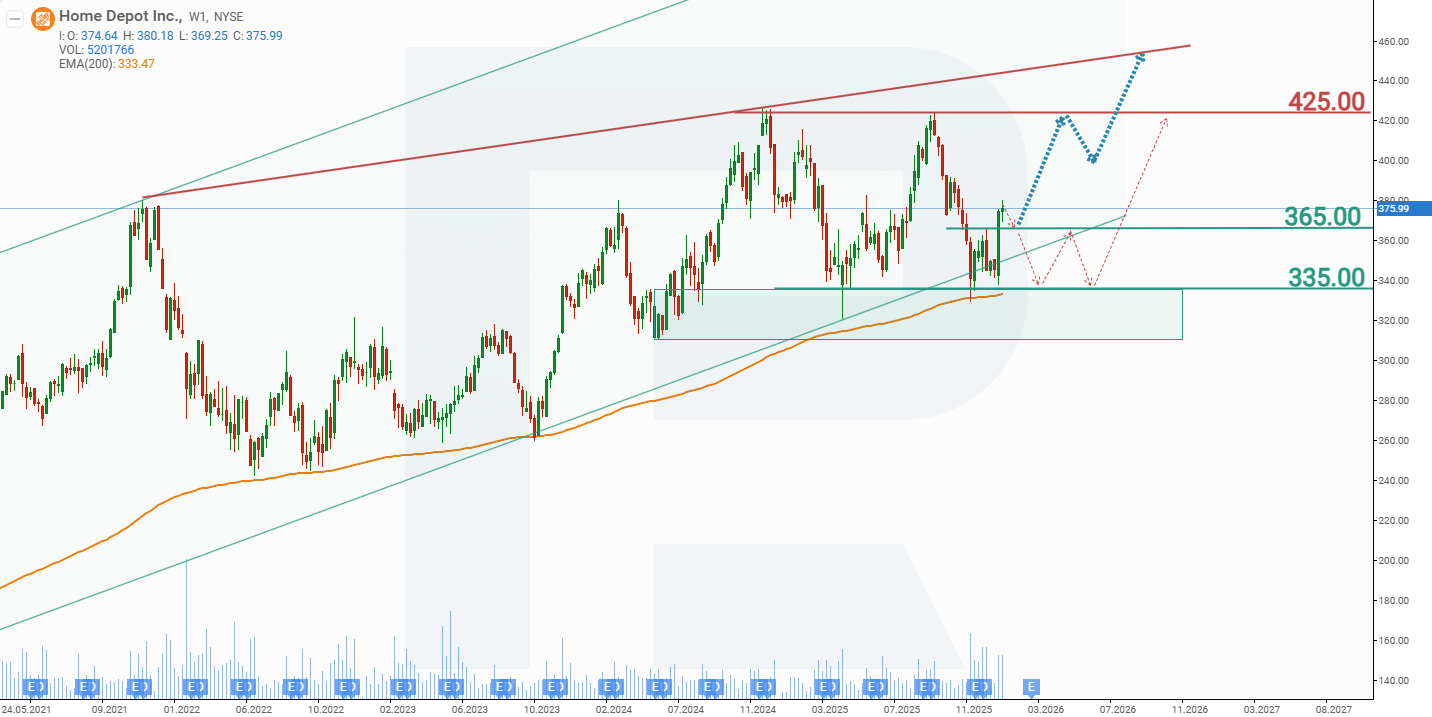
The base-case forecast for Home Depot stock implies further upside, with HD rising towards resistance at 425 USD. If this level is breached, the share price could advance to 450 USD in 2026.
The alternative forecast for Home Depot shares assumes a break below support at 365 USD. In this scenario, HD shares could decline towards 335 USD, after which consolidation is expected in the range between 365 and 335 USD. A breakout from this range would depend on the performance of the US economy: if economic growth continues, as currently forecast, a move back above 365 USD is likely, followed by a renewed advance towards 425 USD.
Risks of investing in The Home Depot, Inc. stock
Investing in Home Depot stock involves a range of external and internal risk factors that could negatively impact the company’s revenue and financial performance. The key risks include:
- Dependence on broader economic conditions and the housing market: Demand for home improvement and construction products is closely linked to macroeconomic factors, mortgage interest rates, and housing market activity. A recession, rising interest rates, or a slowdown in residential construction could result in reduced sales.
- Volatility in raw material prices and logistics costs: Increases in the cost of lumber, metals, oil, or transportation may drive up input costs, potentially squeezing margins or dampening consumer demand.
- Competitive and pricing pressures: Home Depot faces intense competition from Lowe’s, Menards, Amazon, and other retailers. Greater pricing pressure or a loss of market share could weigh on revenue and profitability.
- Exposure to the professional customer segment (Pro): The Pro segment accounts for a significant share of revenue. A slowdown in construction activity or a decline in demand from contractors could affect the company’s financial results.
- Changes in consumer behaviour: A decline in interest in DIY projects, particularly among younger demographics, or a shift towards online channels dominated by other players could challenge Home Depot’s traditional retail model.
- Regulatory and labour-related risks: Stricter labour regulations, higher minimum wages, or recruitment and retention difficulties could increase operating costs and compromise service quality.
These risks should be considered when assessing Home Depot’s business model resilience and the long-term outlook for its shares.
Forecasts presented in this section only reflect the author’s private opinion and should not be considered as guidance for trading. RoboForex bears no responsibility for trading results based on trading recommendations described in these analytical reviews.