US Tech forecast: the index enters sideways channel
The US Tech index is trading in a sideways channel with a prevailing downtrend. The US Tech forecast for next week is negative.
US Tech forecast: key takeaways
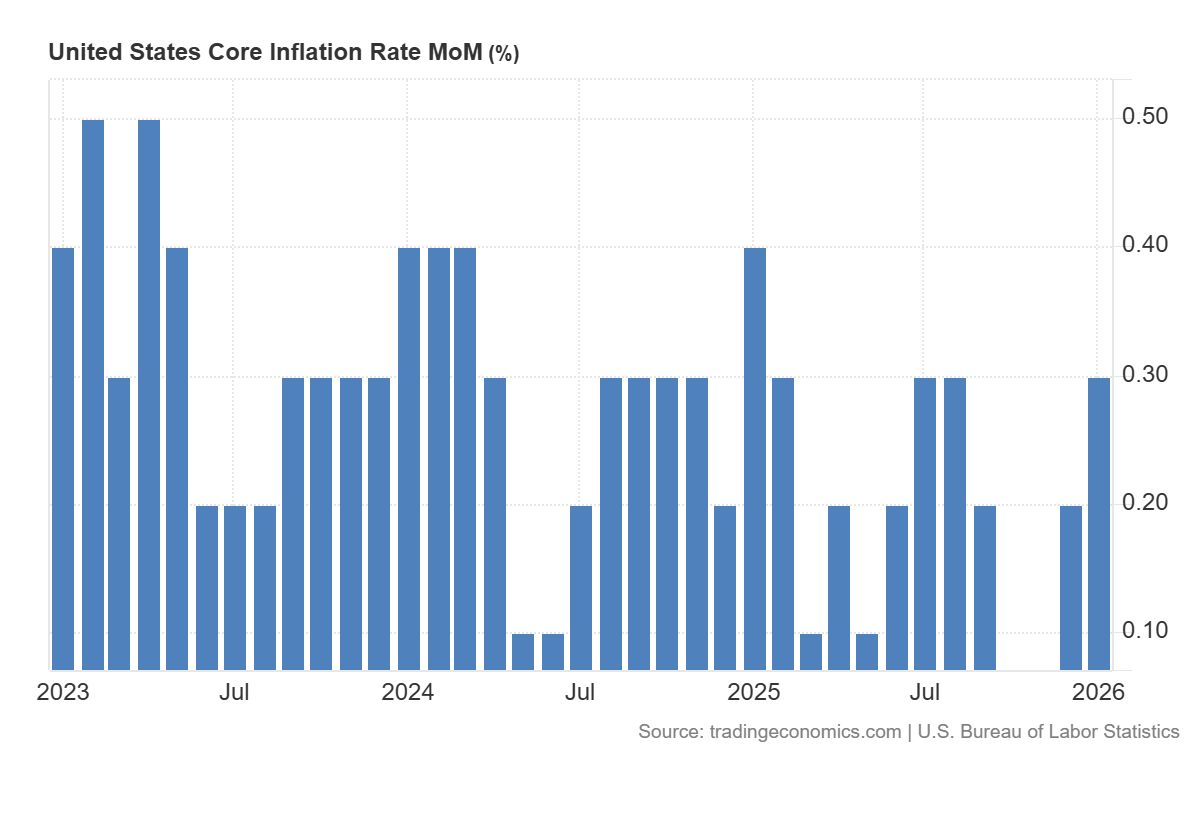
- Recent data: US core CPI for January came in at 0.3%
- Market impact: the effect on the technology sector is mixed
US Tech fundamental analysis
The release of the US core CPI at 0.3% month-on-month, in line with the 0.3% forecast, is neutral in terms of surprise. However, the acceleration compared to the previous reading of 0.2% is perceived as a signal that inflationary pressure remains persistent in the most sensitive index component for the Federal Reserve. For the market, this implies that room for a rapid and aggressive rate cut remains limited: the regulator gains an argument for caution and the need for additional confirmation of disinflation before shifting to a more accommodative policy stance.
For the US Tech index, the impact is typically reflected through movements in government bond yields and rate expectations. The technology sector generally reacts more strongly than others to changes in the cost of money, as a significant portion of its valuation is based on expectations of future cash flows. When core inflation does not show clear signs of slowing, yields may remain elevated or rise, restraining upward revaluation of technology stocks. At the same time, since the figure matched expectations, the immediate reaction is often limited: the market is more likely to reassess medium-term expectations and become increasingly sensitive to upcoming inflation data and Federal Reserve commentary.
US Tech technical analysis
For the broader US equity market, the news also has a mixed but overall restrained effect. The lack of deviation from the forecast reduces the risk of sharp moves; however, the acceleration of the core index compared to the previous month supports the scenario of higher rates for longer, possibly limiting the upside potential of major indices.
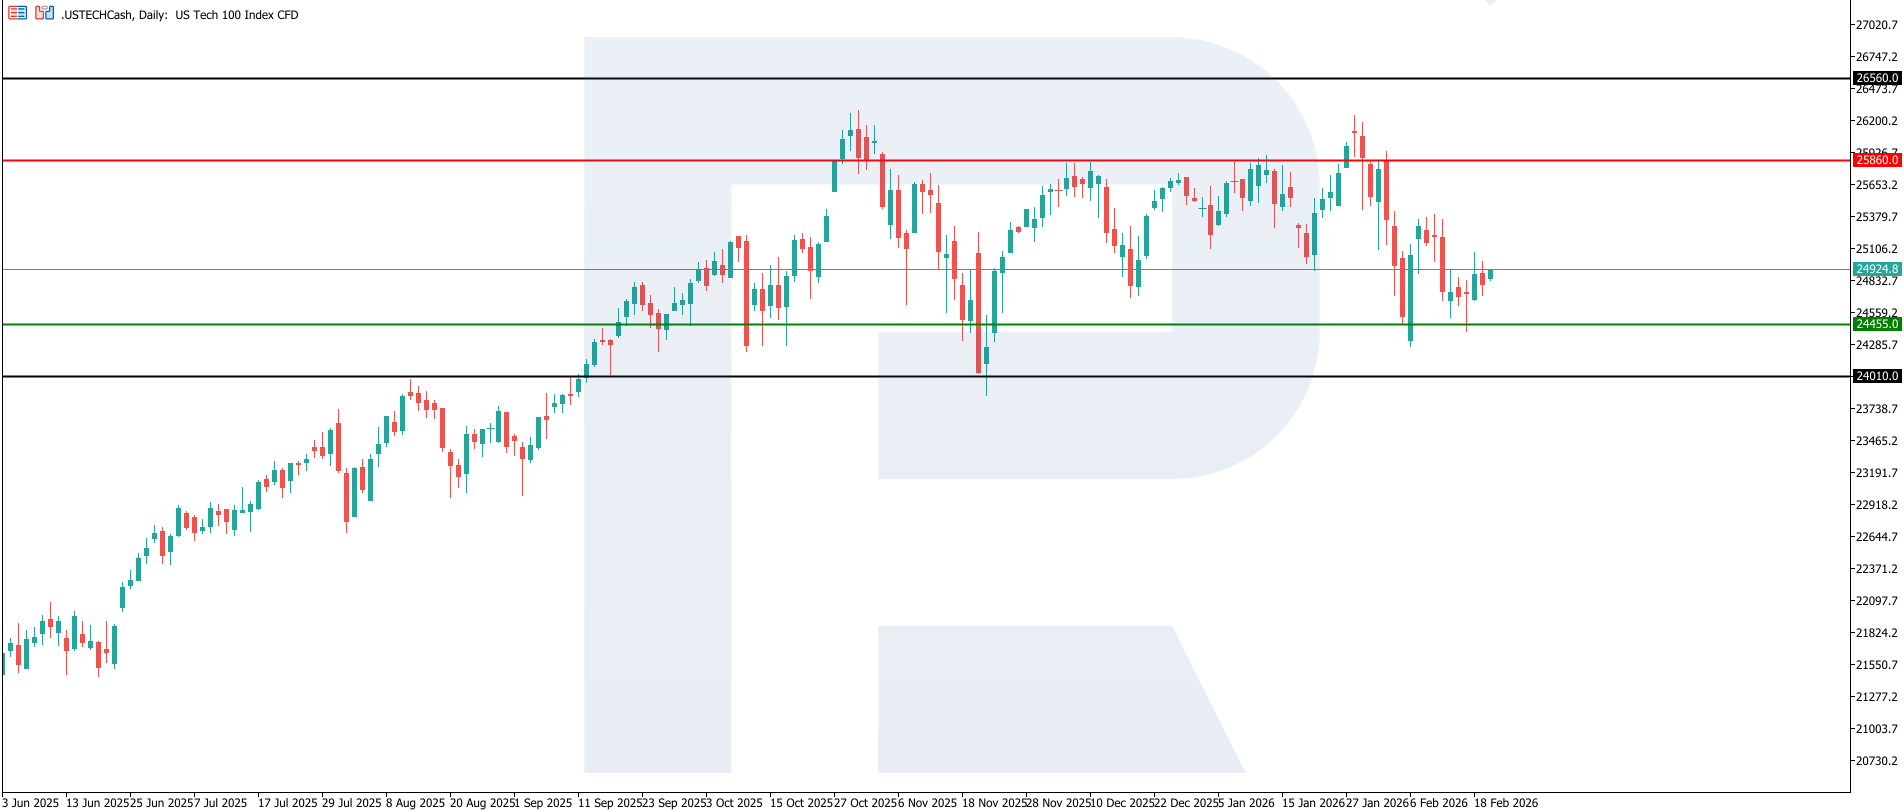
The US Tech index entered a phase of downward momentum, with the nearest resistance level at 25,860.0 and the key support level at 24,455.0. The corrective movement has evolved into a sustained decline, with losses exceeding 6.5%. If pressure persists, the next downside target may be the 24,010.0 level.
The US Tech price forecast outlines the following scenarios:
- Pessimistic US Tech scenario: a breakout below the 24,455.0 support level could send the index to 24,010.0
- Optimistic US Tech scenario: a breakout above the 25,860.0 resistance level could boost the index to 26,560.0
Summary
The news is not surprising, but it reinforces a cautious inflation backdrop. For the US Tech, this means continued dependence on the yield trajectory and Federal Reserve signals. For the broader US stock market, it suggests a more likely scenario of moderate performance, with increased importance placed on corporate results and earnings quality, and limited potential for valuation expansion until more convincing signs of core inflation slowdown emerge. The next downside target could be the 24,010.0 level.
Editors’ picks
 EURUSD 2026-2027 forecast: key market trends and future predictions
This article provides the EURUSD forecast for 2026 and 2027 and highlights the main factors determining the direction of the pair’s movements. We will apply technical analysis, take into account the opinions of leading experts, large banks, and financial institutions, and study AI-based forecasts. This comprehensive insight into EURUSD predictions should help investors and traders make informed decisions.
 Gold (XAUUSD) forecast 2026 and beyond: expert insights, price predictions, and analysis
Dive deep into the Gold (XAUUSD) price outlook for 2026 and beyond, combining technical analysis, expert forecasts, and key macroeconomic factors. It explains the drivers behind gold’s recent surge, explores potential scenarios including a move toward 4,500 to 5,000 USD per ounce, and highlights why the metal remains a strong hedge during global uncertainty.
Forecasts presented in this section only reflect the author’s private opinion and should not be considered as guidance for trading. RoboForex bears no responsibility for trading results based on trading recommendations described in these analytical reviews.