World indices overview: news from US 30, US 500, US Tech, JP 225, and DE 40 for 26 June 2025
The ceasefire between Iran and Israel lifted investor sentiment, pushing global stock indices higher. Find out more in our analysis and forecast for 26 June 2025.
US indices forecast: US 30, US 500, US Tech
- Recent data: US new home sales totalled 623 thousand in May
- Market impact: declining new home sales are a negative signal for the market, as the housing sector is linked to a wide range of industries and affects overall economic growth
Fundamental analysis
New home sales reflect the seasonally adjusted number of new single-family homes sold in the previous month. The actual reading came in at 623 thousand homes, below the forecast of 694 thousand and the previous 722 thousand. This drop in sales indicates a slowdown in the housing market, potentially signalling reduced consumer spending and increased economic caution.
The fall in sales negatively affects construction companies, as well as manufacturers of building materials and equipment. The lower-than-expected new home sales figure indicates housing market weakness and creates a negative backdrop for equities, especially in construction, financial, and consumer sectors.
US 30 technical analysis
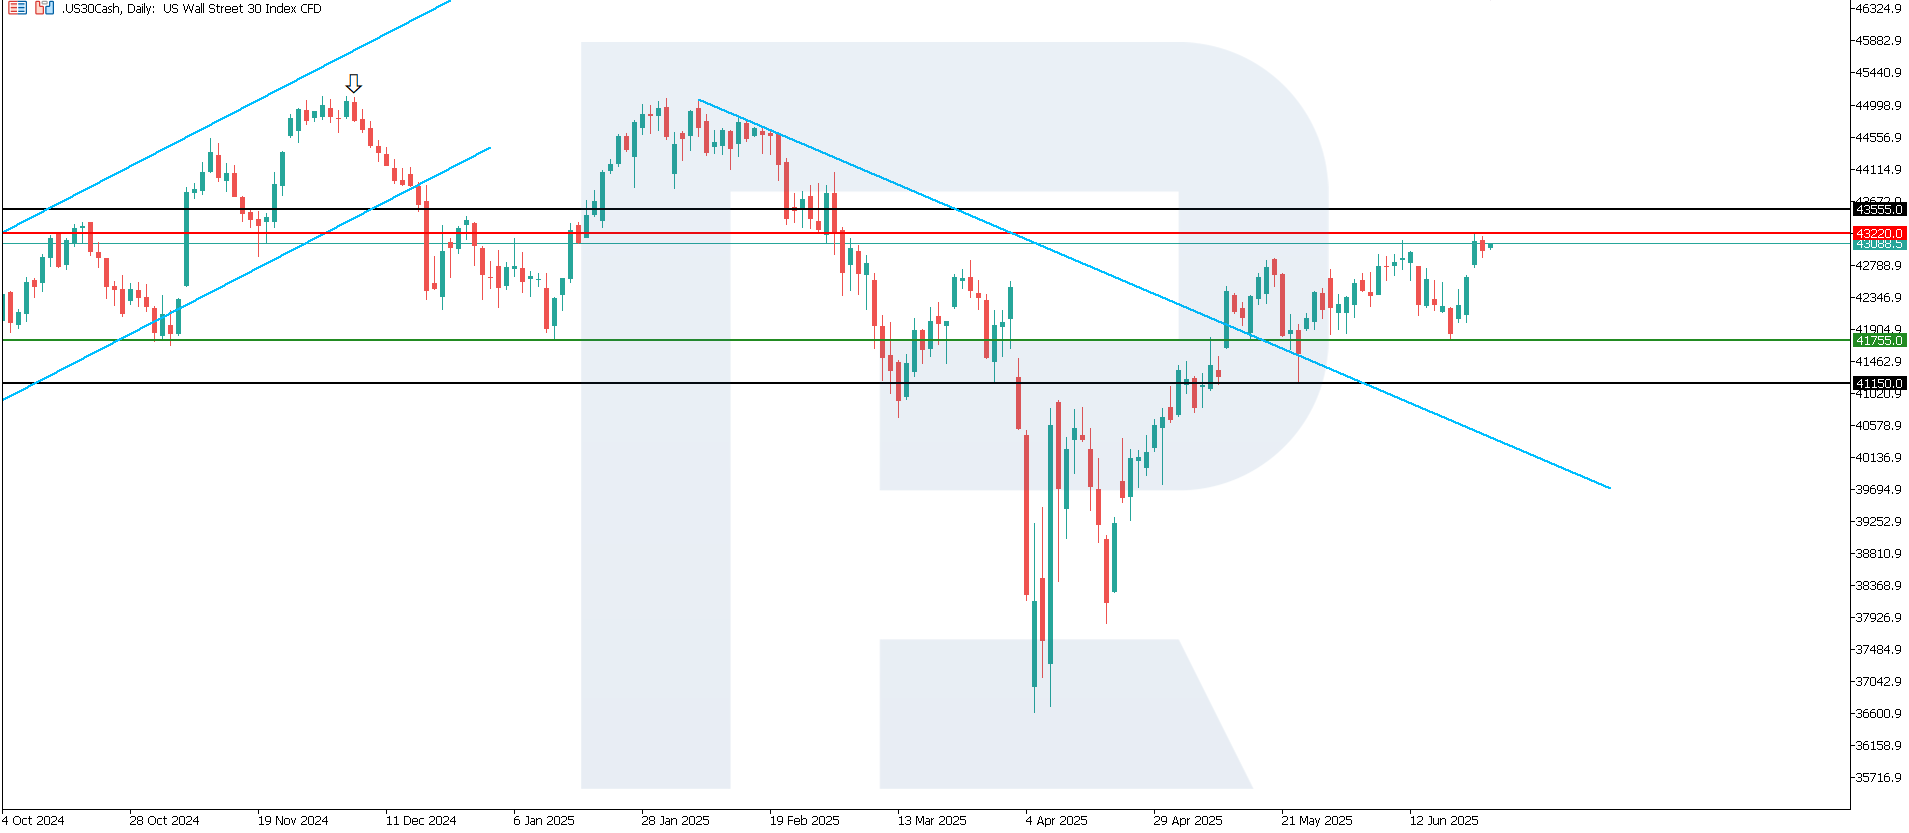
The US 30 index broke above the previous 42,760.0 resistance level, with support remaining at 41,755.0 and resistance shifting to 43,220.0. It is worth noting the strong momentum with which the price rebounded from the resistance level.
The following scenarios are considered for the US 30 price forecast:
- Pessimistic US 30 forecast: a breakout below the 41,755.0 support level could send the index to 41,150.0
- Optimistic US 30 forecast: a breakout above the 43,220.0 resistance level could boost the index to 43,355.0
US 500 technical analysis
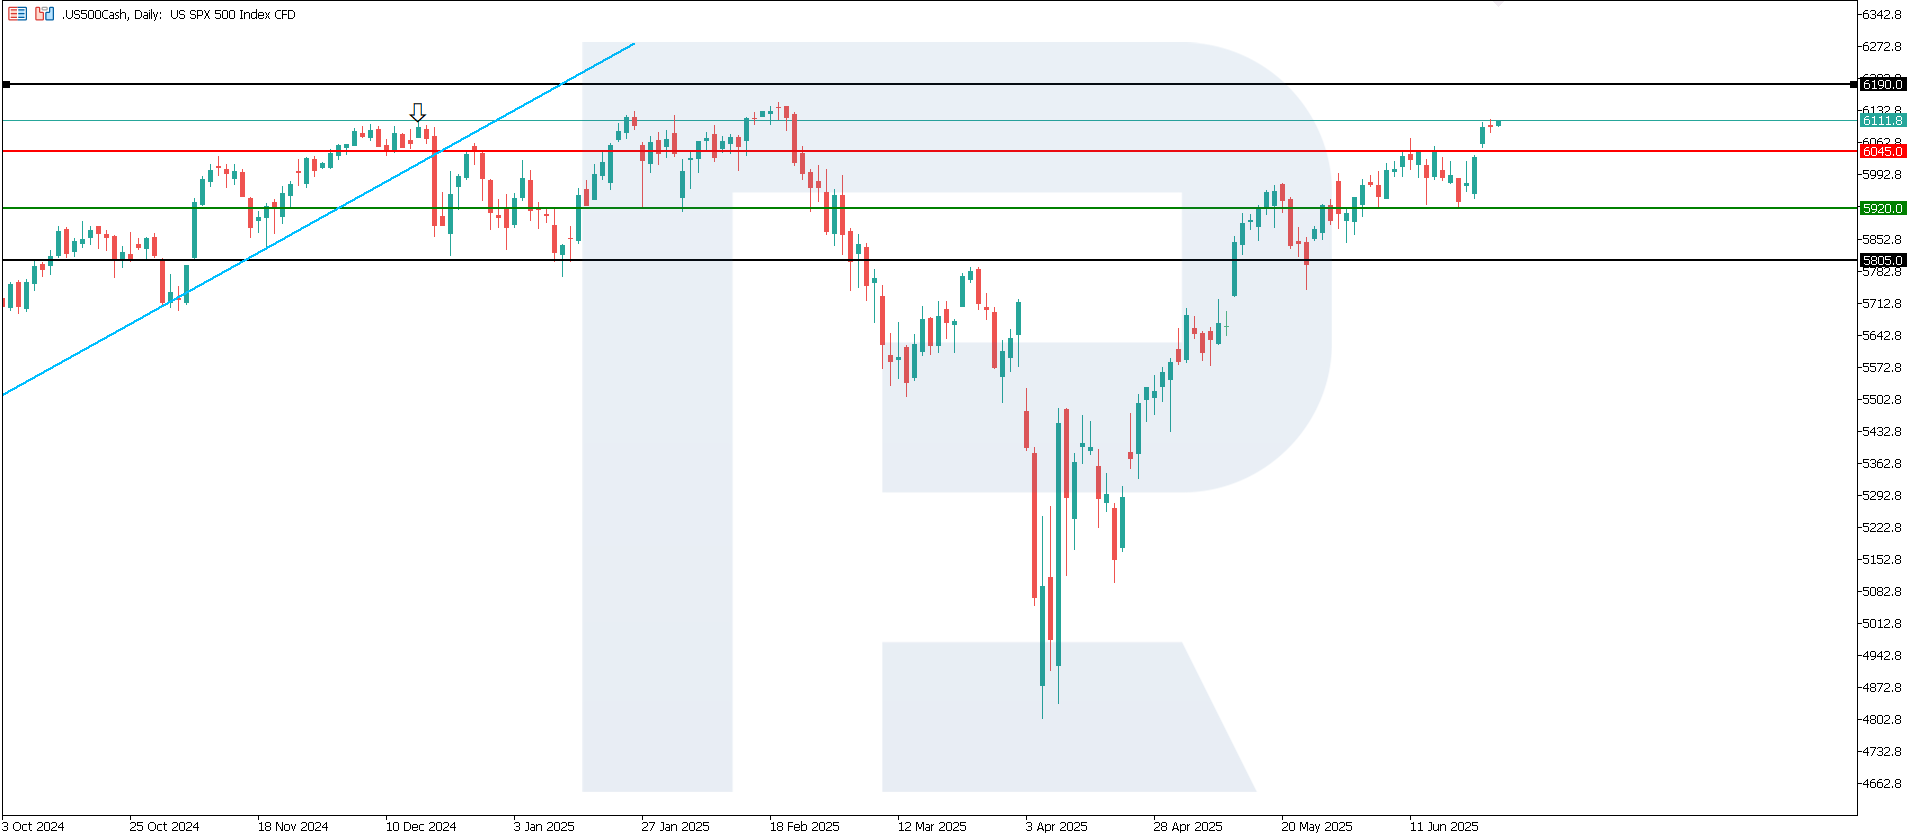
The US 500 index is poised to hit a new all-time high: the support level remains at 5,920.0, while the 6,045.0 resistance level was breached, with a new one yet to form. There are still prerequisites for a continuation of the bullish trend.
The following scenarios are considered for the US 500 price forecast:
- Pessimistic US 500 forecast: a breakout below the 5,920.0 support level could push the index down to 5,745.0
- Optimistic US 500 forecast: if the price consolidates above the breached resistance level at 6,045.0, the index could climb to 6,190.0
US Tech technical analysis
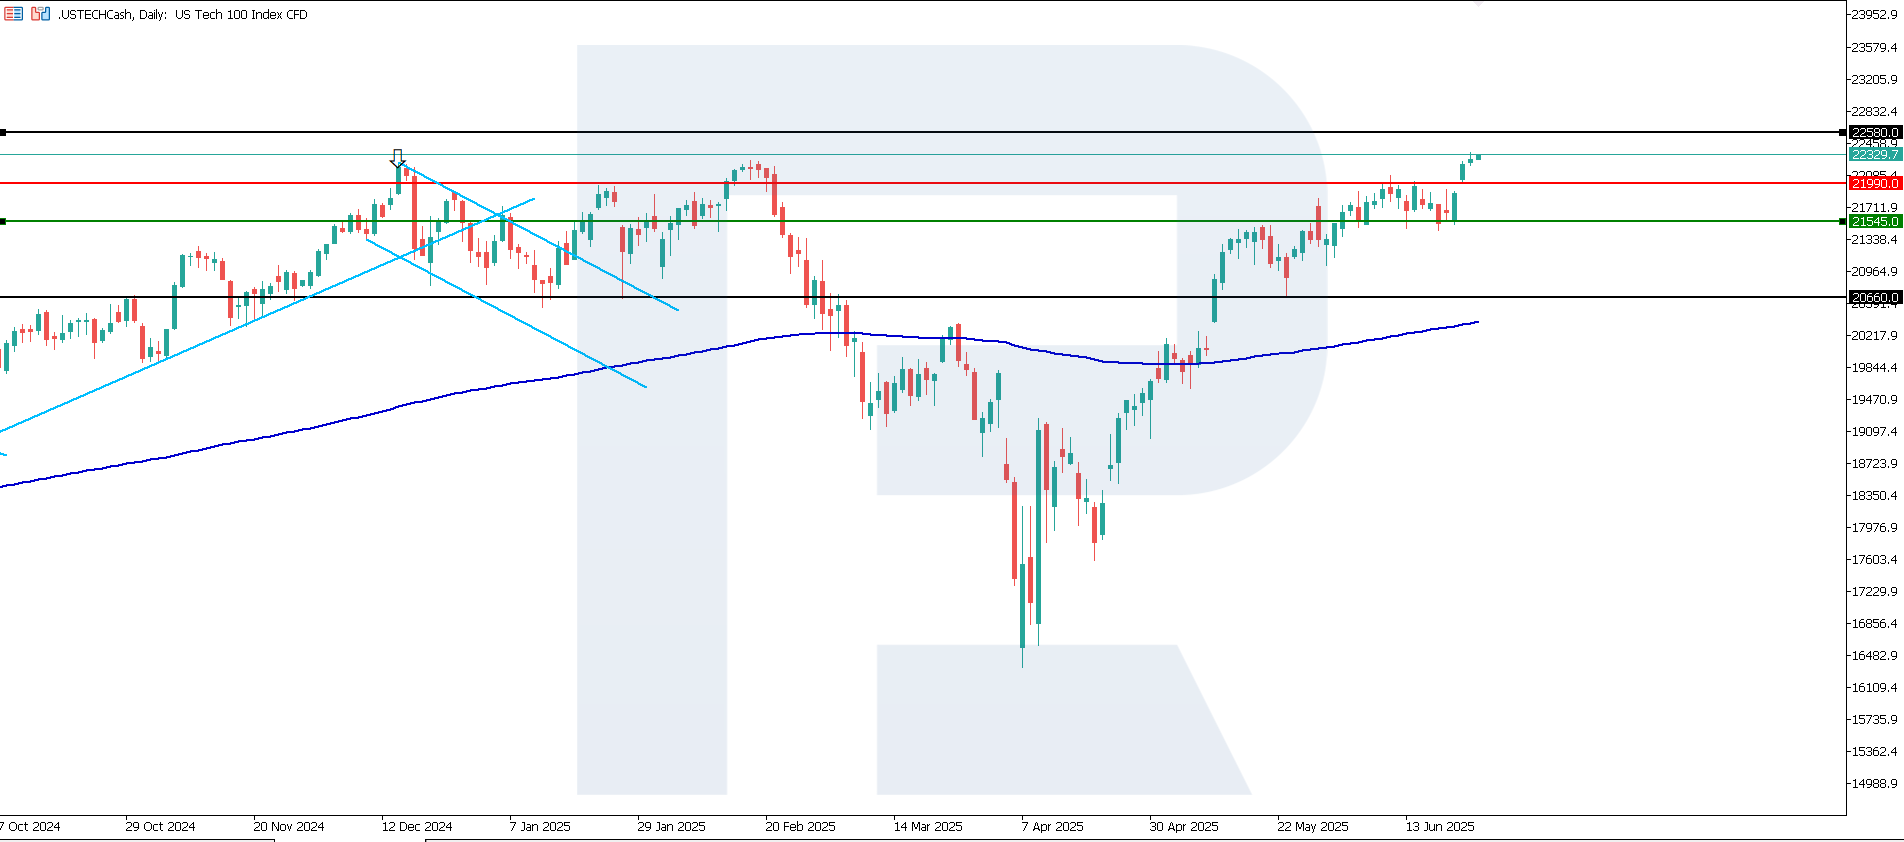
The US Tech index reached a new all-time high. The price broke above the 21,990.0 resistance level, with a new one yet to form. The support level has shifted to 21,545.0. The index continues to move within an uptrend and shows potential for further growth.
The following scenarios are considered for the US Tech price forecast:
- Pessimistic US Tech forecast: a breakout below the 21,545.0 support level could send the index down to 20,660.0
- Optimistic US Tech forecast: a breakout above the 21,990.0 resistance level could drive the index to 22,580.0
Asian index forecast: JP 225
- Recent data: Japan’s services PMI for May came in at 51.5
- Market impact: growth in the services PMI boosts investor confidence and suggests steady economic development, which positively affects the stock market
Fundamental analysis
The services PMI above 50.0 (51.5) signals expanding activity, with the rise from 51.0 to 51.5 indicating positive momentum and accelerating growth in the services sector. This figure is a key indicator of economic health, as services make up a large portion of Japan's GDP. Growth in service technologies and digital services is also gaining momentum, benefiting tech companies.
The increase in Japan’s services PMI reflects expanding activity in the services sector, contributing to equity market gains and strengthening economic optimism. This is a positive sign for consumer services, financial, and technology sectors.
JP 225 technical analysis
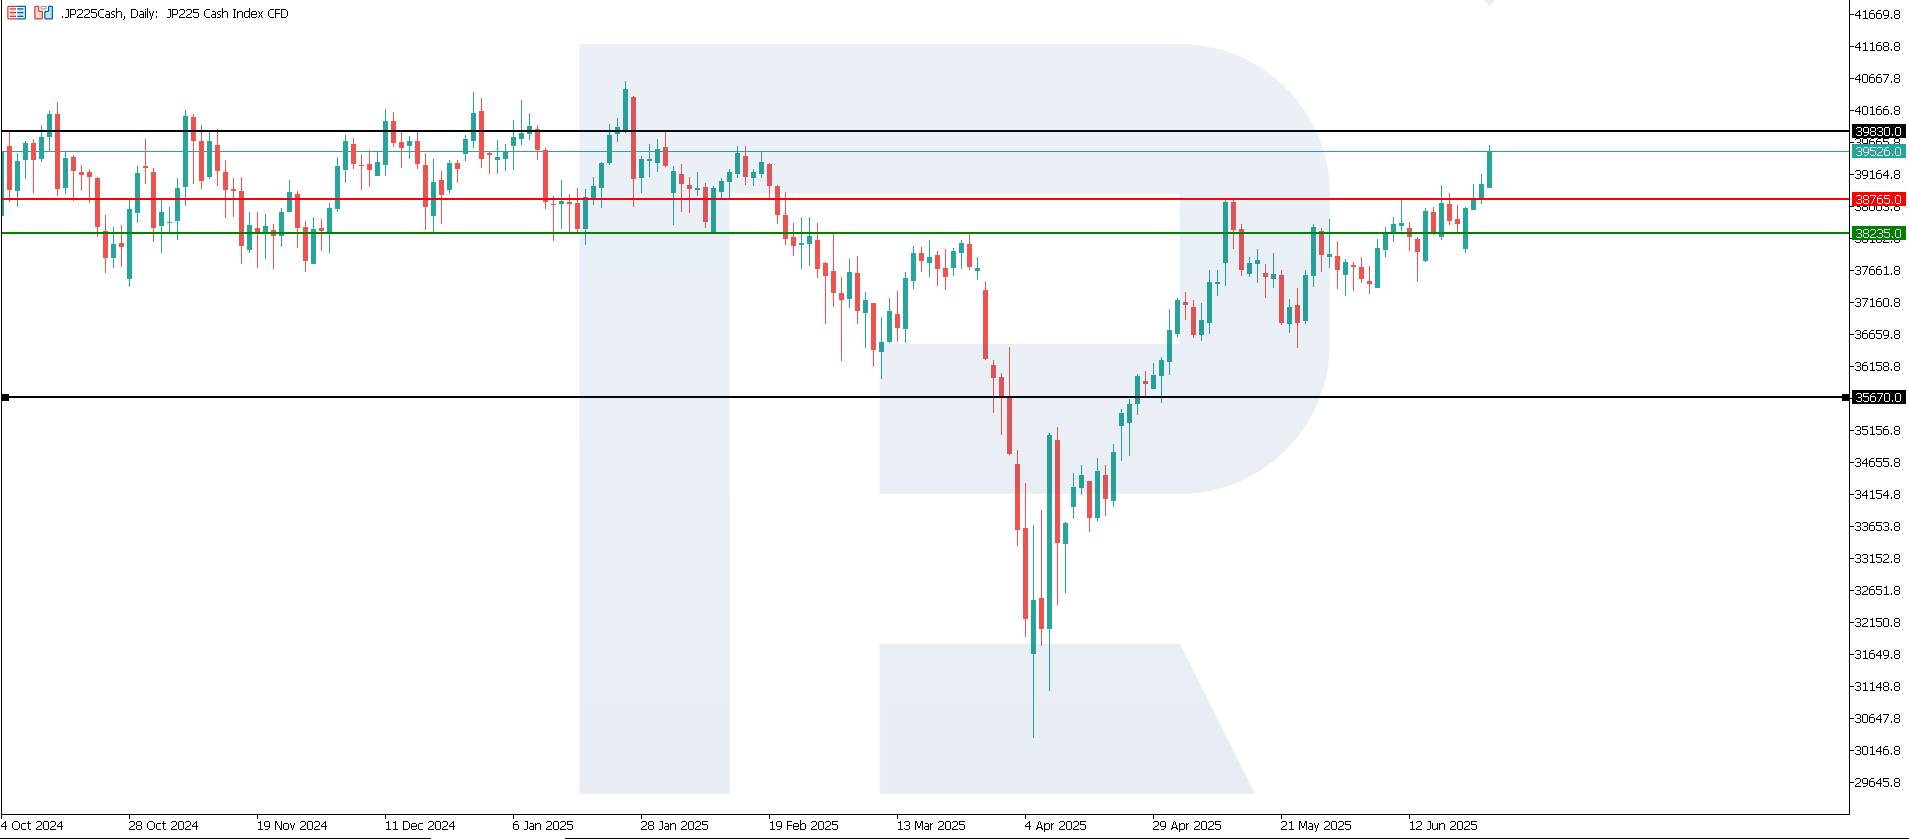
The JP 225 index rebounded from the 36,590.0 support level and broke above resistance at 38,765.0. A new support level formed at 38,235.0. A breakout above resistance confirms the continuation of the medium-term uptrend. There are currently no signs in the market, indicating a trend reversal.
The following scenarios are considered for the JP 225 price forecast:
- Pessimistic JP 225 forecast: a breakout below the 38,235.0 support level could push the index down to 35,670.0
- Optimistic JP 225 forecast: if the price consolidates above the breached resistance level at 38,765.0, the index could rise to 39,830.0
European index forecast: DE 40
- Recent data: Germany’s services PMI for May came in at 49.4
- Market impact: a reading below 50.0 signals contracting activity, which may make investors cautious and put pressure on stocks, particularly those tied to services
Fundamental analysis
The services PMI below 50.0 (49.4) indicates contraction in the services sector. However, the actual result surpassed both the forecast of 47.8 and the previous reading of 47.1, suggesting the pace of contraction is slowing. This is a crucial economic indicator, as services account for a significant part of Germany’s economy.
The services PMI below 50.0 points to shrinking activity in Germany’s services sector, creating a negative outlook for equities, especially in the consumer and financial sectors. However, the better-than-expected result may ease pressure on the market.
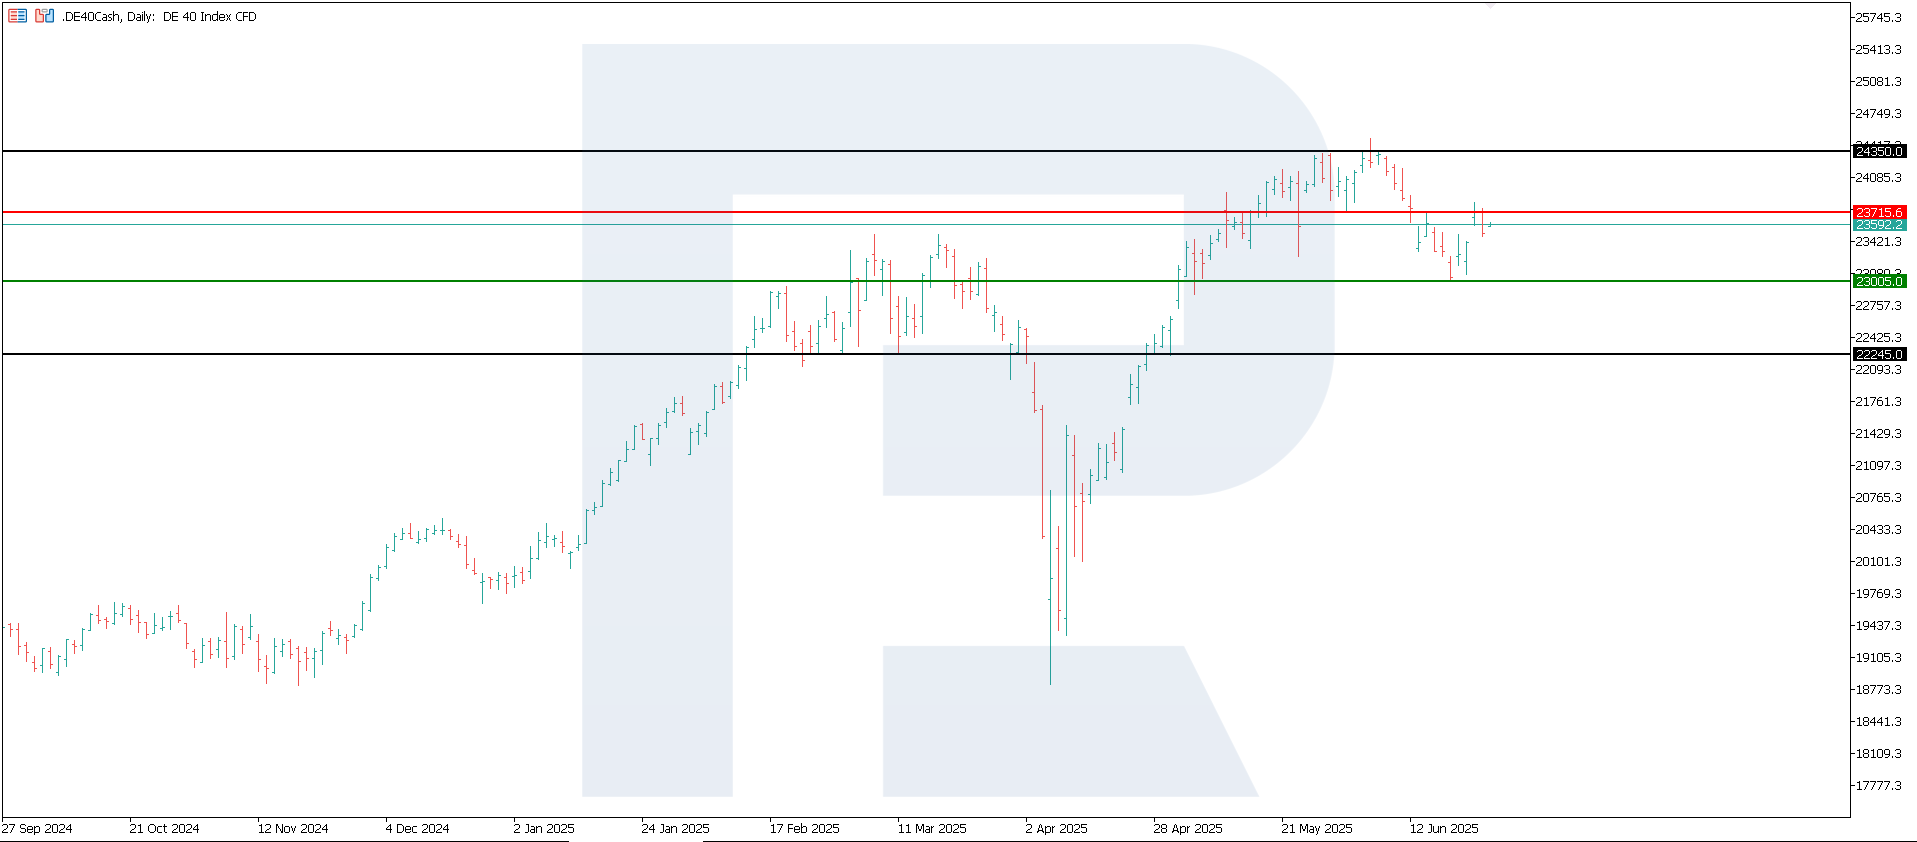
DE 40 technical analysis
The DE 40 index broke below the 23,270.0 support level, marking the end of the medium-term uptrend. However, the decline will likely be short-term, and growth may resume. A new support level has now formed at 23,005.0.
The following scenarios are considered for the DE 40 price forecast:
- Pessimistic DE 40 forecast: a breakout below the 23,005.0 support level could send the index down to 22,245.0
- Optimistic DE 40 forecast: a breakout above the 23,715.0 resistance level could push the index higher to 24,855.0
Summary
The conflict involving the US, Israel, and Iran has not escalated into a large-scale and prolonged confrontation – this has bolstered investor optimism. The US Tech index reached a new all-time high. Japan’s JP 225 has reversed into an uptrend. The US 500 index also looks set to break new highs. A bullish trend has reappeared in the US 30 index.
Investors will now refocus on macroeconomic data from the US, EU, and other developed economies, with particular attention to inflation indicators and the impact of new US tariffs.
Forecasts presented in this section only reflect the author’s private opinion and should not be considered as guidance for trading. RoboForex bears no responsibility for trading results based on trading recommendations described in these analytical reviews.