World indices overview: news from US 30, US 500, US Tech, JP 225, and DE 40 for 10 June 2025
The US labour market remains strong, shifting the Federal Reserve's focus to inflation figures, now the defining factor for global stock index trends. Find out more in our analysis and forecast for 10 June 2025.
US indices forecast: US 30, US 500, US Tech
- Recent data: the US unemployment rate was 4.2% in May
- Market impact: stable unemployment and soft job growth reinforce hopes for interest rate cuts in the coming months, which could be a bullish factor for the market
Fundamental analysis
Moderate NFP growth reduces the risk of aggressive Fed policy tightening. This may support stocks, especially in the technology and consumer sectors. These figures can sustain the uptrend in the market, although without strong momentum, investors will likely await additional signals from CPI data and Federal Reserve comments.
Concerns over inflation remain significant. In the US, around 70% of companies facing higher costs due to tariffs reported passing them on to consumers: roughly 30% of manufacturing firms and 45% of service firms passed along all cost increases to consumers, while another 45% of manufacturers and 30% of service providers passed on some costs.
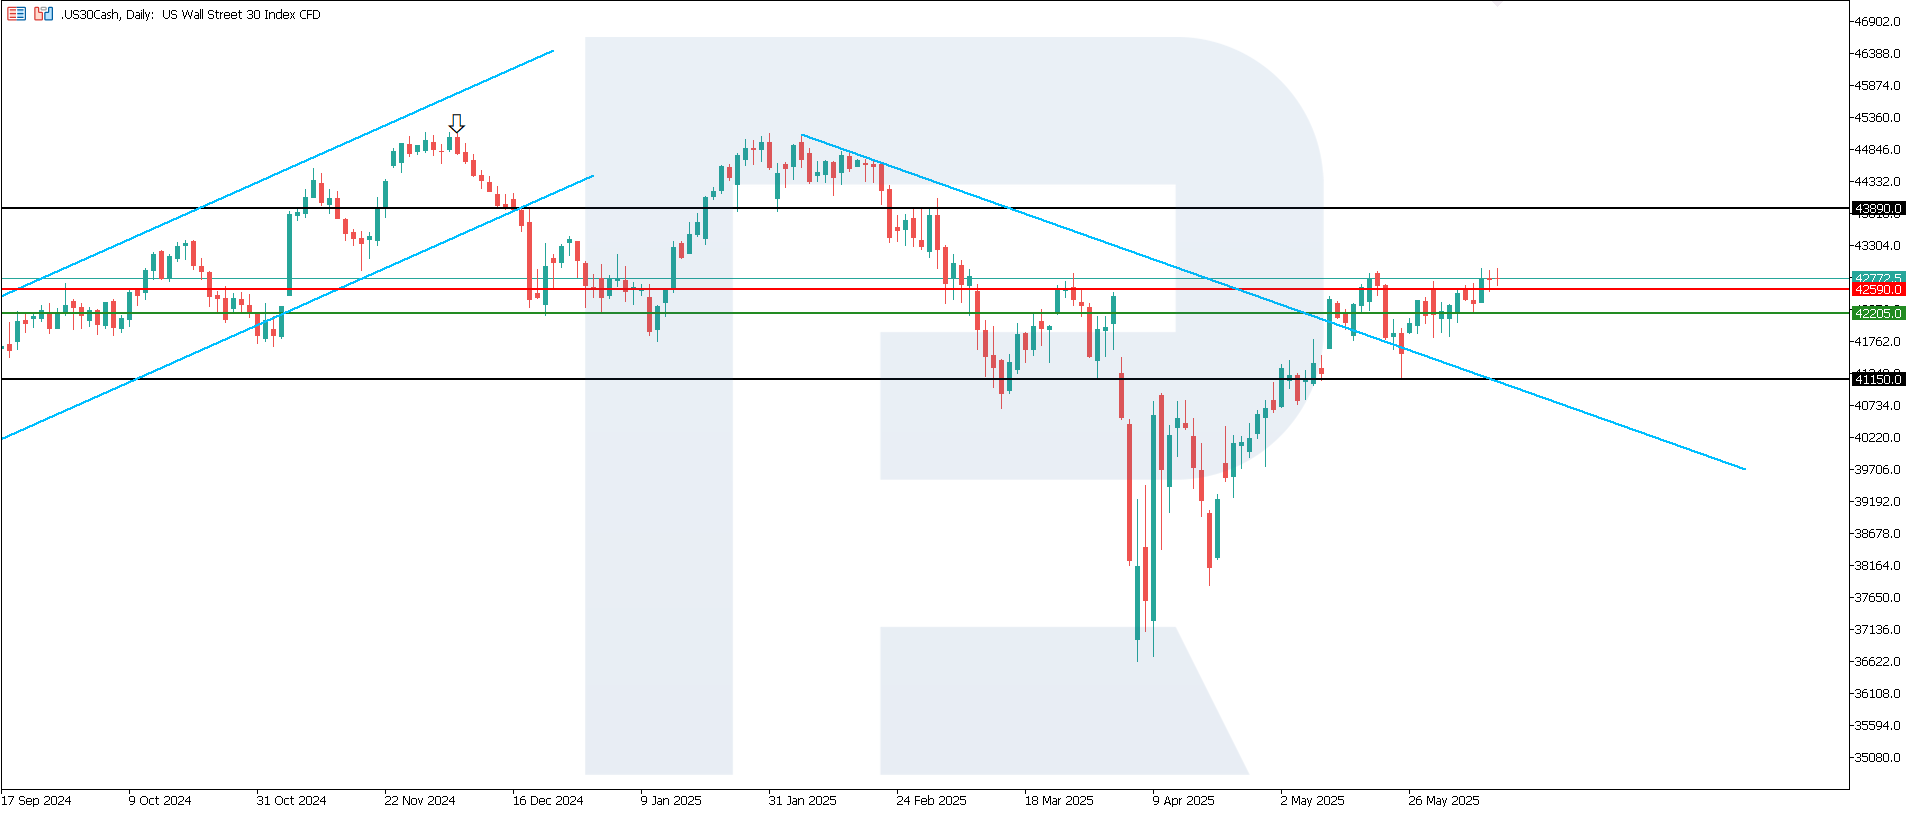
US 30 technical analysis
The US 30 index broke above the 42,590.0 resistance level, with a new one yet to form. The support level shifted to 42,205.0. The US 30 outlook remains unstable. The momentum of the current uptrend is relatively weak and may shift into a sideways pattern.
The following scenarios are considered for the US 30 price forecast:
- Pessimistic US 30 forecast: a breakout below the 42,205.0 support level could push the index to 41,150.0
- Optimistic US 30 forecast: if the price consolidates above the breached resistance level at 42,590.0, the index could climb to 43,890.0
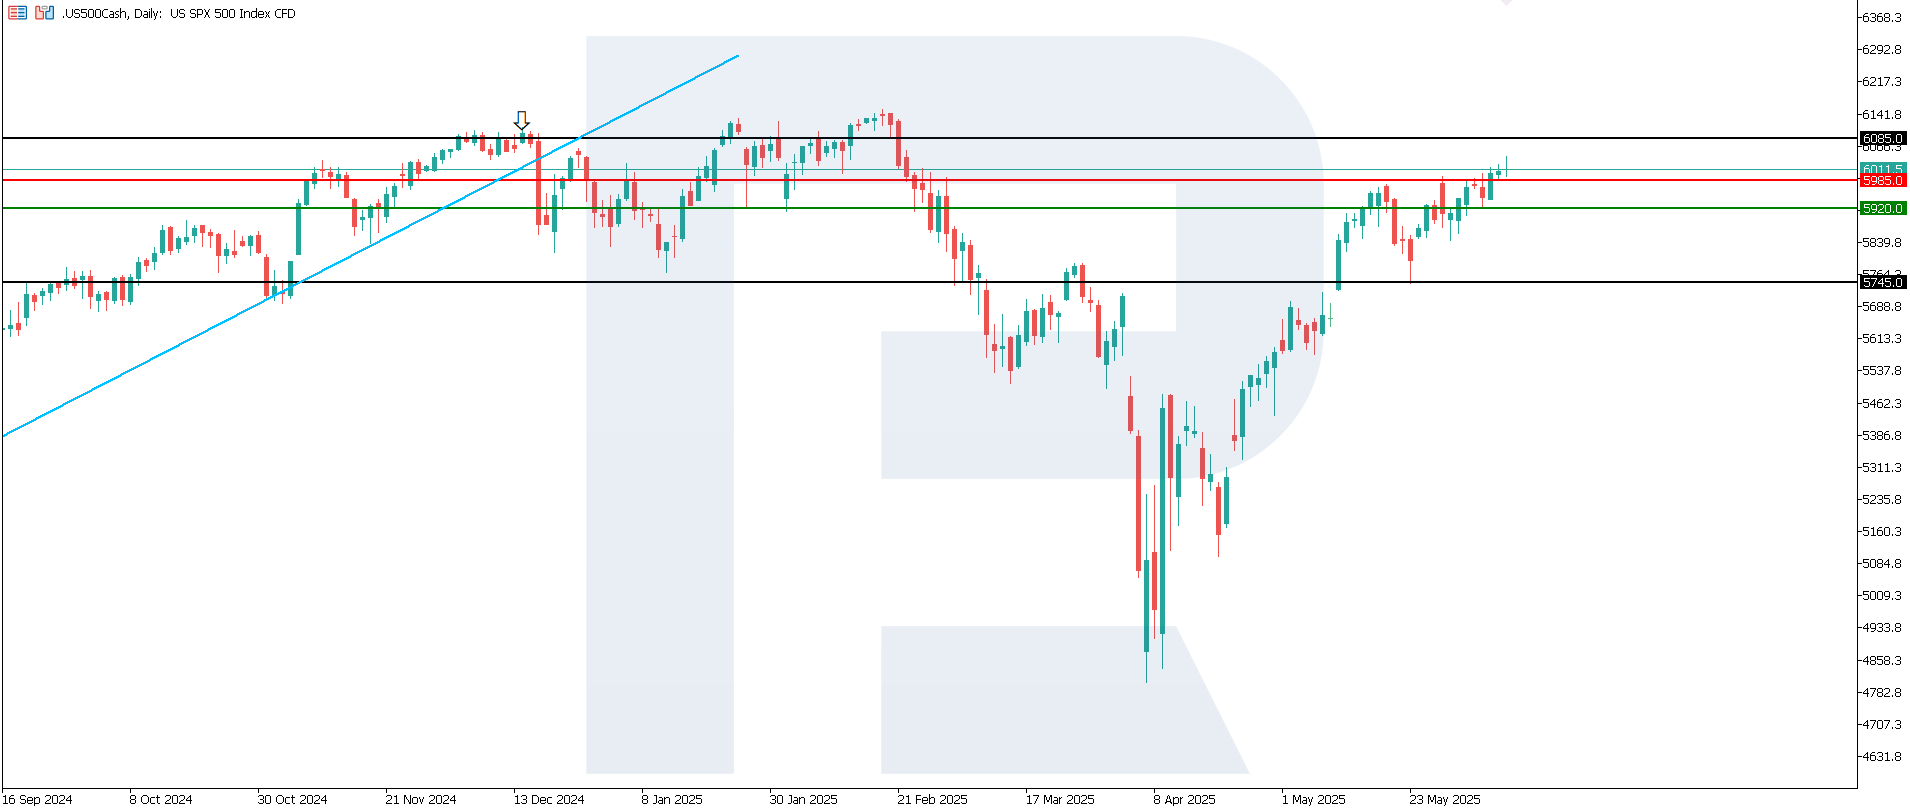
US 500 technical analysis
The US 500 index continues to rise, with the support level shifting to 5,920.0. The price broke above the 5,985.0 resistance level, with a new one yet to form. The index is attempting to consolidate above the previous resistance level.
The following scenarios are considered for the US 500 price forecast:
- Pessimistic US 500 forecast: a breakout below the 5,920.0 support level could send the index down to 5,745.0
- Optimistic US 500 forecast: if the price consolidates above the breached resistance level at 5,985.0, the index could rise to 6,085.0
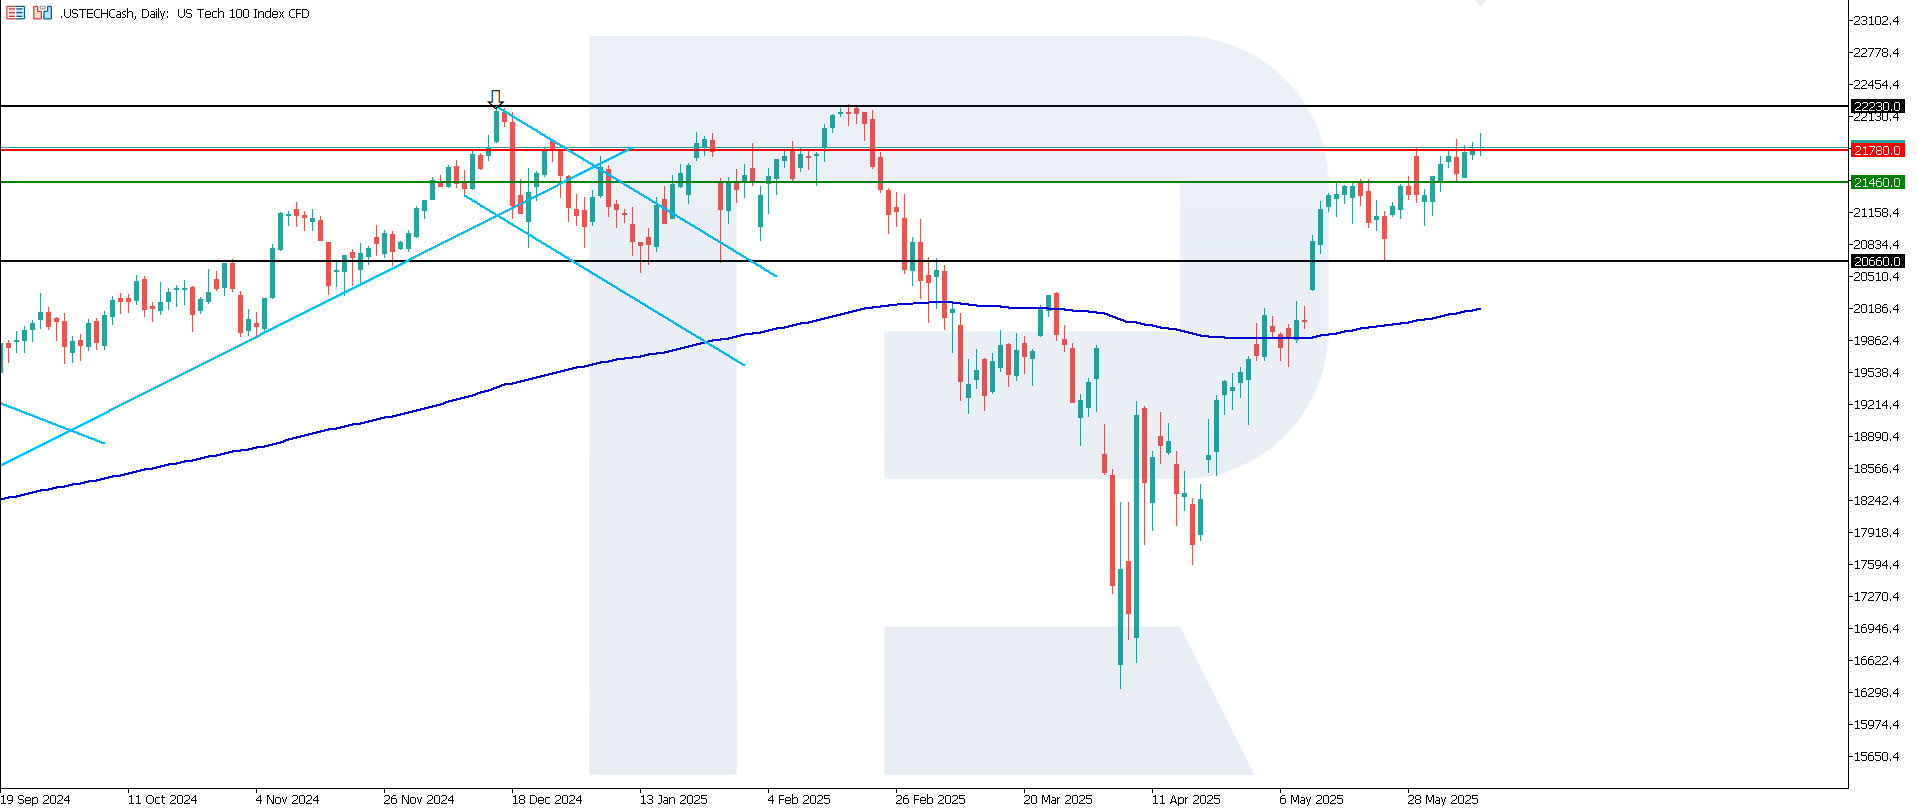
US Tech technical analysis
The US Tech index broke above the 21,780.0 resistance level, with a new one yet to form. The support level has shifted to 21,460.0. A stable medium-term uptrend will likely form.
The following scenarios are considered for the US Tech price forecast:
- Pessimistic US Tech forecast: a breakout below the 21,460.0 support level could push the index down to 20,660.0
- Optimistic US Tech forecast: if the price consolidates above the previously breached resistance level at 21,780.0, the index could advance to 22,230.0
Asian index forecast: JP 225
- Recent data: Japan’s GDP for Q1 2025 remained unchanged
- Market impact: positive market reaction is possible as the economy did not shrink, contrary to expectations
Fundamental analysis
Japan’s actual GDP growth was 0.0%, better than the expected -0.2% but worse than +0.6% in the previous quarter. This indicates stabilisation of the economy despite external pressure. Investors may expect the Bank of Japan to soften its stance: with weak growth and no inflationary pressure, stimulus is likely to continue.
Domestic market-focused companies will benefit more, particularly in real estate, retail, and transport. However, the lack of growth limits the room for a strong bullish trend. Market inertia may keep the index within a sideways or mildly upward range.
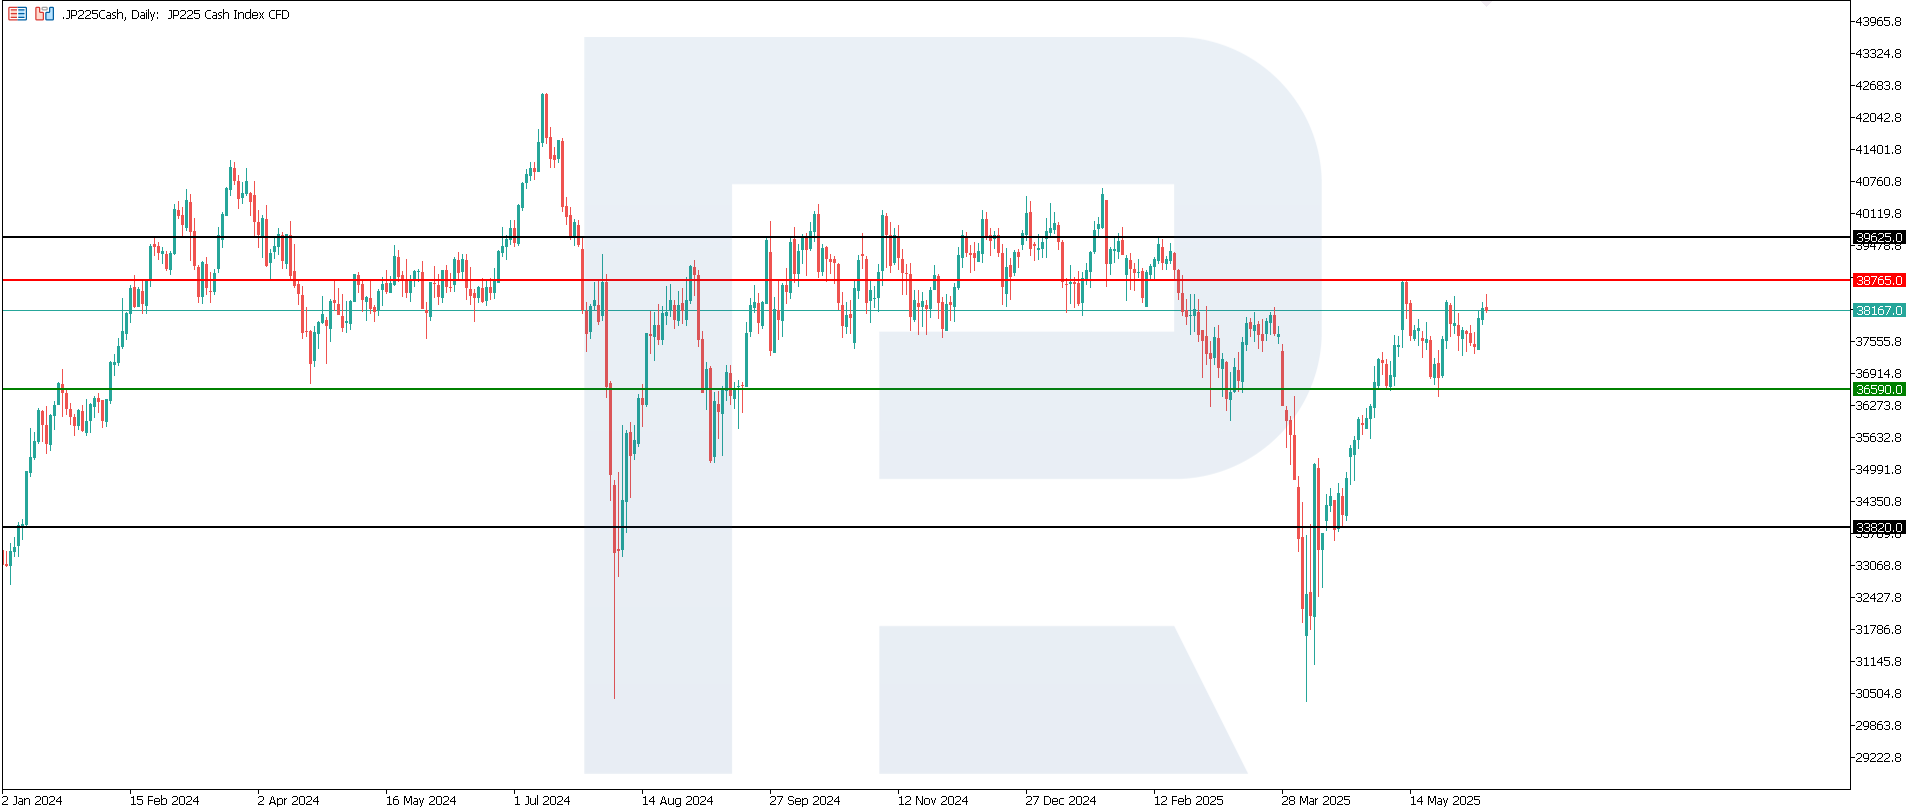
JP 225 technical analysis
After rebounding from the 36,590.0 support level, the JP 225 index continues to edge up and is approaching the 38,765.0 resistance level. A successful breakout would confirm continued medium-term upward momentum. At this point, there are no signs of a possible trend reversal.
The following scenarios are considered for the JP 225 price forecast:
- Pessimistic JP 225 forecast: a breakout below the 36,590.0 support level could push the index down to 33,820.0
- Optimistic JP 225 forecast: a breakout above the 38,765.0 resistance level could drive the index to 39,625.0
European index forecast: DE 40
- Recent data: Germany’s industrial production for April fell by 1.4%
- Market impact: industrial and export-oriented stocks may come under pressure
Fundamental analysis
Germany’s industrial production for April fell by 1.4% month-on-month, coming in below the forecast of -0.9% and sharply contrasting with the previous gain of 3%. This means the country’s key industrial sector slowed significantly after a brief recovery.
The industrial production report is viewed as a bearish signal for the German stock market, especially if the trend continues in May and June. Investors may turn cautious on cyclical stocks and shift focus towards defensive sectors.
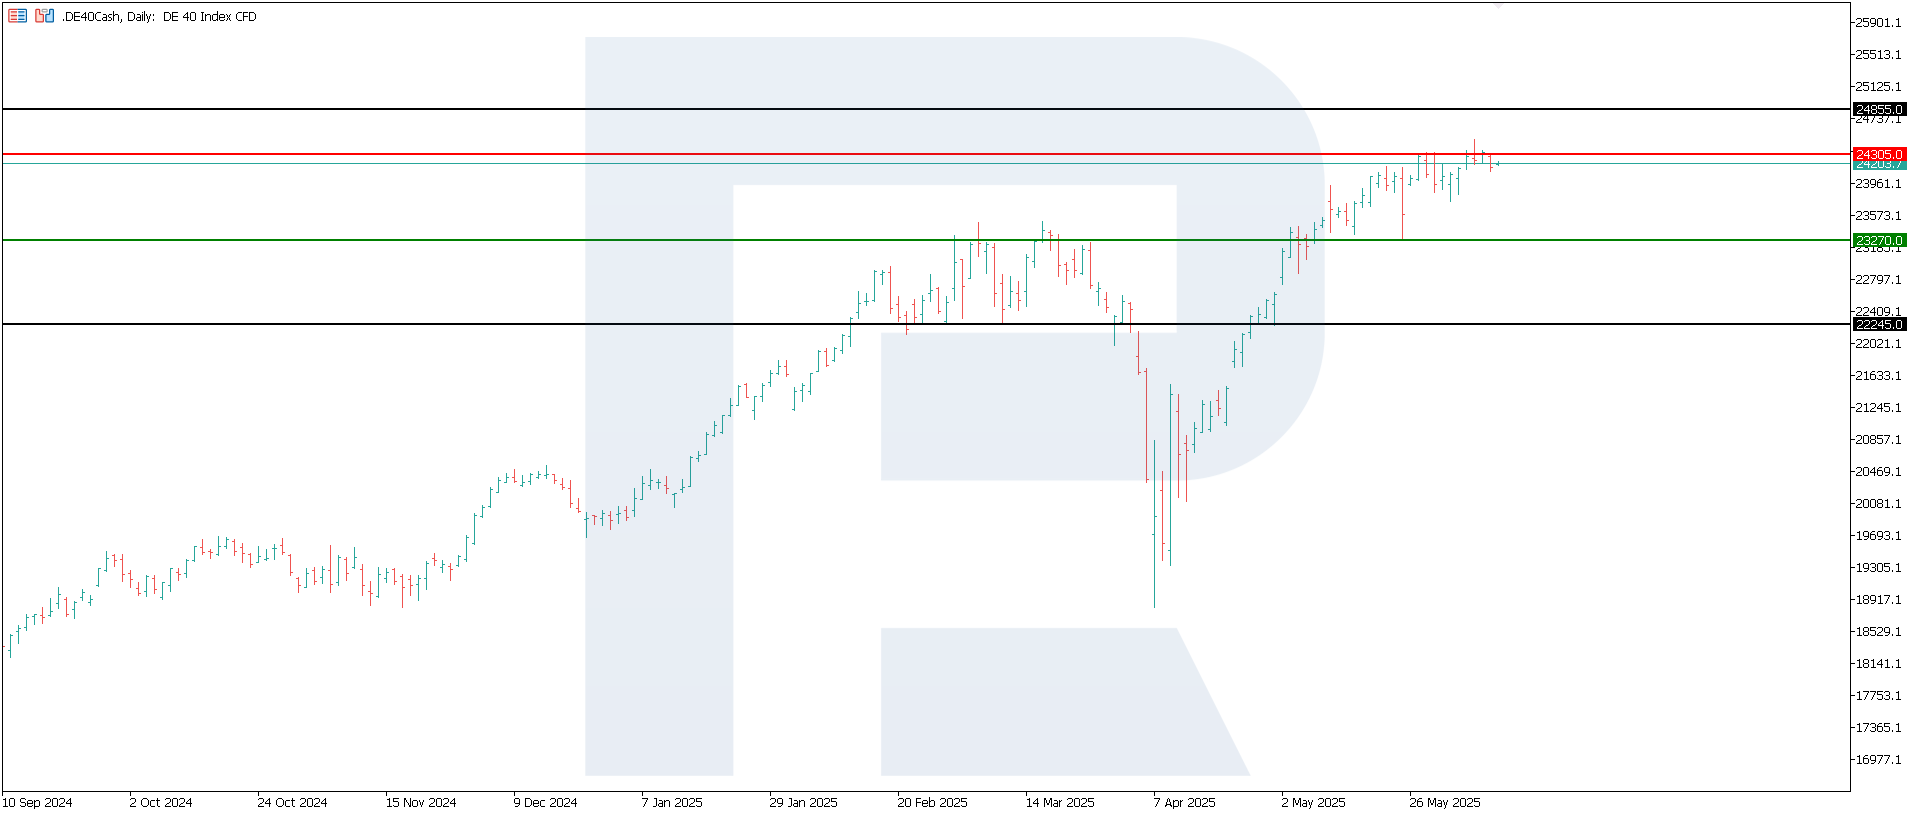
DE 40 technical analysis
The DE 40 index has formed key levels, with resistance at 24,305.0 and support around 23,270.0. The current price structure indicates a stable uptrend, increasing the likelihood of new all-time highs in the near term.
The following scenarios are considered for the DE 40 price forecast:
- Pessimistic DE 40 forecast: a breakout below the 23,270.0 support level could send the index down to 22,245.0
- Optimistic DE 40 forecast: a breakout above the 24,305.0 resistance level could propel the index to 24,855.0
Summary
The US 30 index broke above the resistance level, signalling a reversal of the previously developing downtrend. Japan’s JP 225 is advancing towards its resistance level. The US 500 and US Tech indices remain within a stable uptrend, while Germany’s DE 40 is targeting another all-time high. Investors will focus on US inflation data as the labour market appears stable and strong. Additionally, interpretations from the Federal Reserve and their forecasts for key macroeconomic indicators will play a crucial role.
Forecasts presented in this section only reflect the author’s private opinion and should not be considered as guidance for trading. RoboForex bears no responsibility for trading results based on trading recommendations described in these analytical reviews.