World indices overview: news from US 30, US 500, US Tech, JP 225, and DE 40 for 29 April 2025
Global stock indices show multidirectional movements amid uncertainty surrounding the US tariff policy. Find out more in our analysis and forecast for global indices for 29 April 2025.
US indices forecast: US 30, US 500, US Tech
- Recent data: initial jobless claims totalled 222 thousand
- Market impact: while a slight increase in claims does not cause panic, investors may remain cautious
Fundamental analysis
The small increase in initial jobless claims indicates a slight deterioration in the labour market, although the result aligns with market expectations. If claims continue to rise in the coming weeks, it may cause expectations of a looser Federal Reserve monetary policy, which will support stocks, especially rate-sensitive ones such as technology stocks.
The indicator is neutral for the US stock market in the short term. However, if the upward trend in claims continues, this may prompt the Fed to ease monetary policy, which in turn would bolster stocks. The market will likely await additional data for now.
US 30 technical analysis
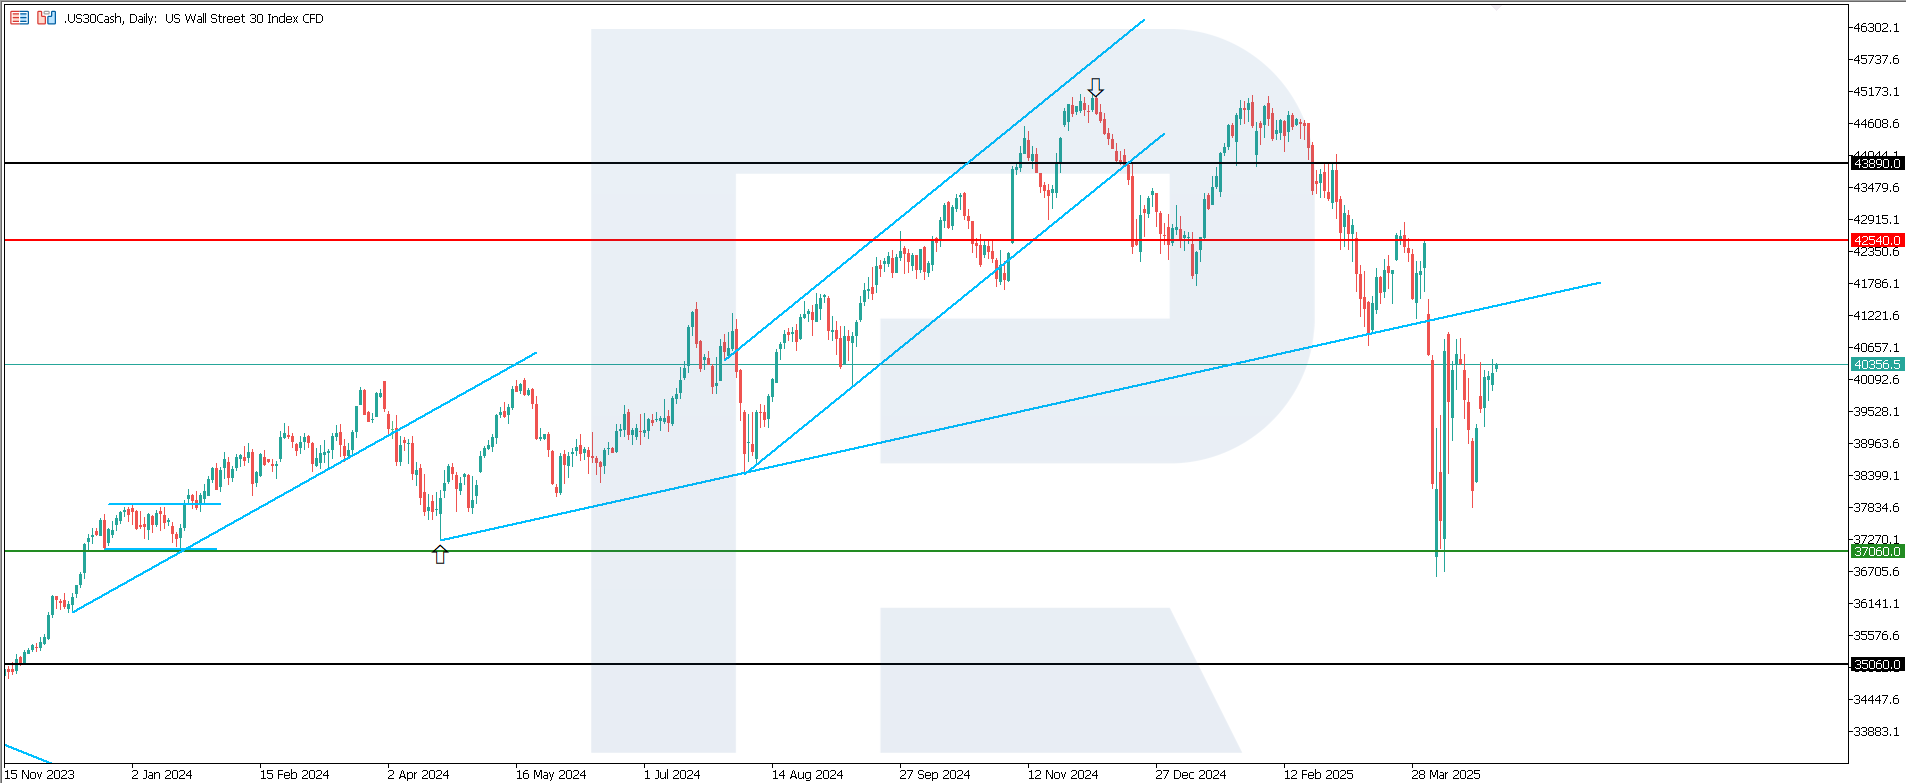
The US 30 stock index remains in a global downtrend despite the renewed optimism. If the 37,060.0 support level does not break, a sideways movement could follow. The index is currently experiencing local growth, albeit weak.
The following scenarios are considered for the US 30 price forecast:
- Pessimistic US 30 forecast: a breakout below the 37,060.0 support level could send the index down to 35,060.0
- Optimistic US 30 forecast: a breakout above the 42,535.0 resistance level could drive the index to 43,890.0
US 500 technical analysis
The US 500 stock index broke above the 5,485.0 resistance level. The index has been rising for five consecutive days, marking the longest winning streak this year. The support level has shifted to 5,465.0.
The following scenarios are considered for the US 500 price forecast:
- Pessimistic US 500 forecast: a breakout below the 5,465.0 support level could push the index down to 5,100.0
- Optimistic US 500 forecast: if the price consolidates above the previously breached resistance level at 5,485.0, quotes could rise to 5,720.0

US Tech technical analysis
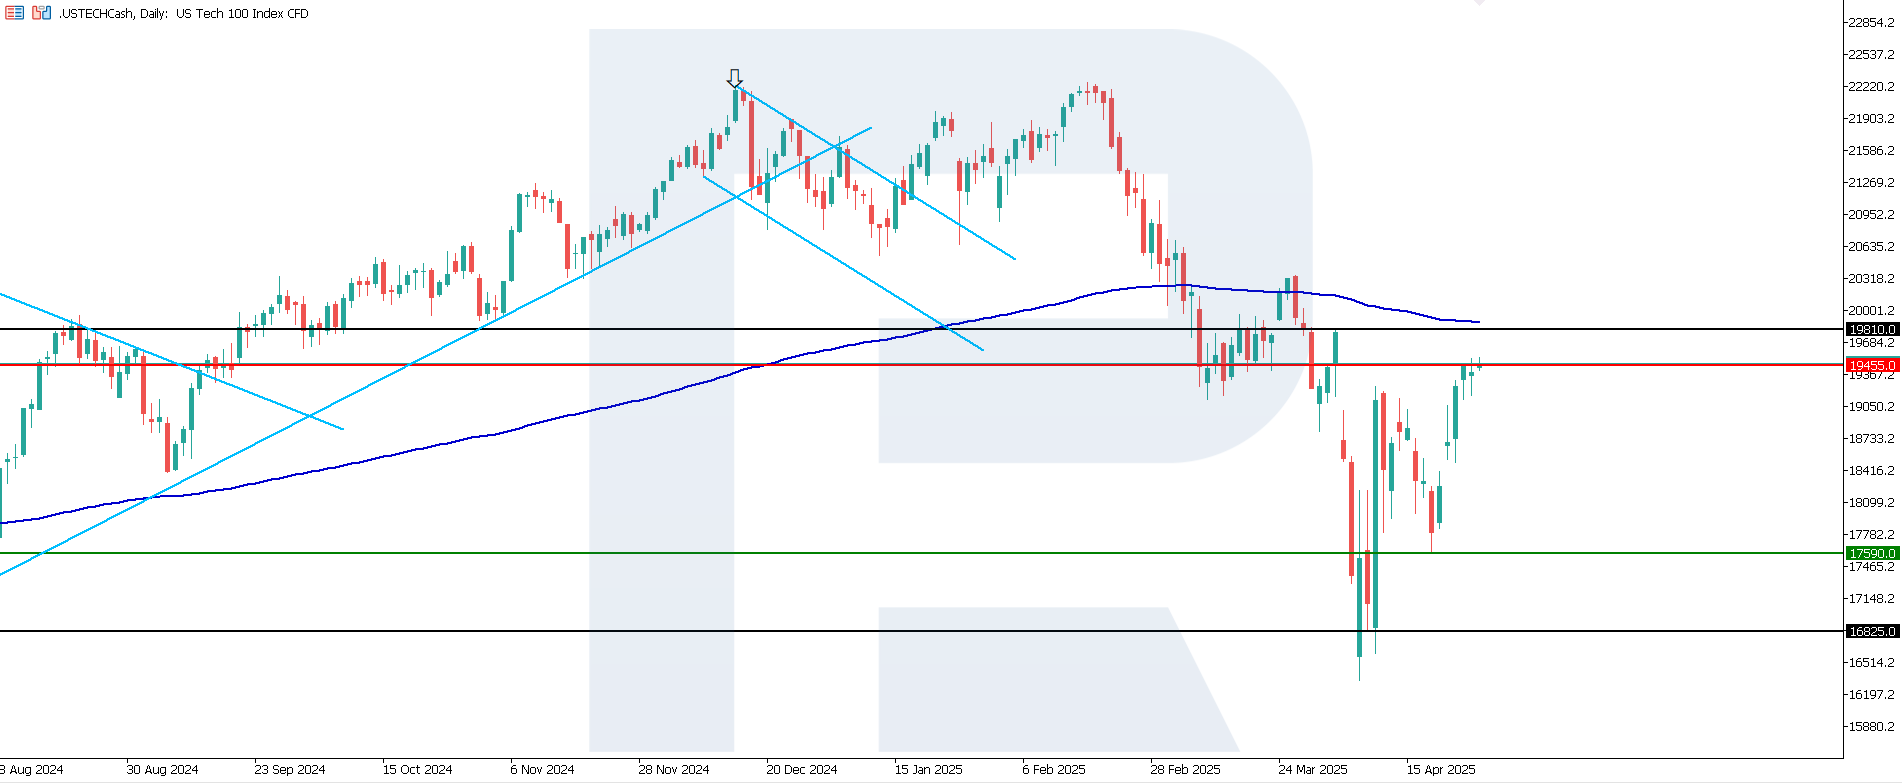
The US Tech index formed a resistance level at 19,455.0, with support at 17,590.0. The current uptrend is weak and is likely to be short-term as quotes are still trading below the 200-day Moving Average.
The following scenarios are considered for the US Tech price forecast:
- Pessimistic US Tech forecast: a breakout below the 17,590.0 support level could send the index down to 16,825.0
- Optimistic US Tech forecast: a breakout above the 19,455.0 resistance level could propel the index to 19,810.0
Asian index forecast: JP 225
- Recent data: Japan Tokyo core Consumer Price Index came in at 3.4% year-on-year
- Market impact: rising inflation may lead to an interest rate hike and weaken the technology sector
Fundamental analysis
Higher-than-expected and significantly faster inflation indicates mounting inflationary pressure in the Japanese economy. Higher inflation increases the likelihood that the Bank of Japan will be prompted to raise rates or reduce monetary stimulus. This may negatively impact the stock market, particularly the stocks of rate-sensitive companies.
A rate hike or rate hike expectations typically strengthen the national currency. A strong yen is negative for exporters as their yen-denominated income from overseas sales declines. The market will likely be cautious in anticipation of the Bank of Japan’s further moves.
JP 225 technical analysis
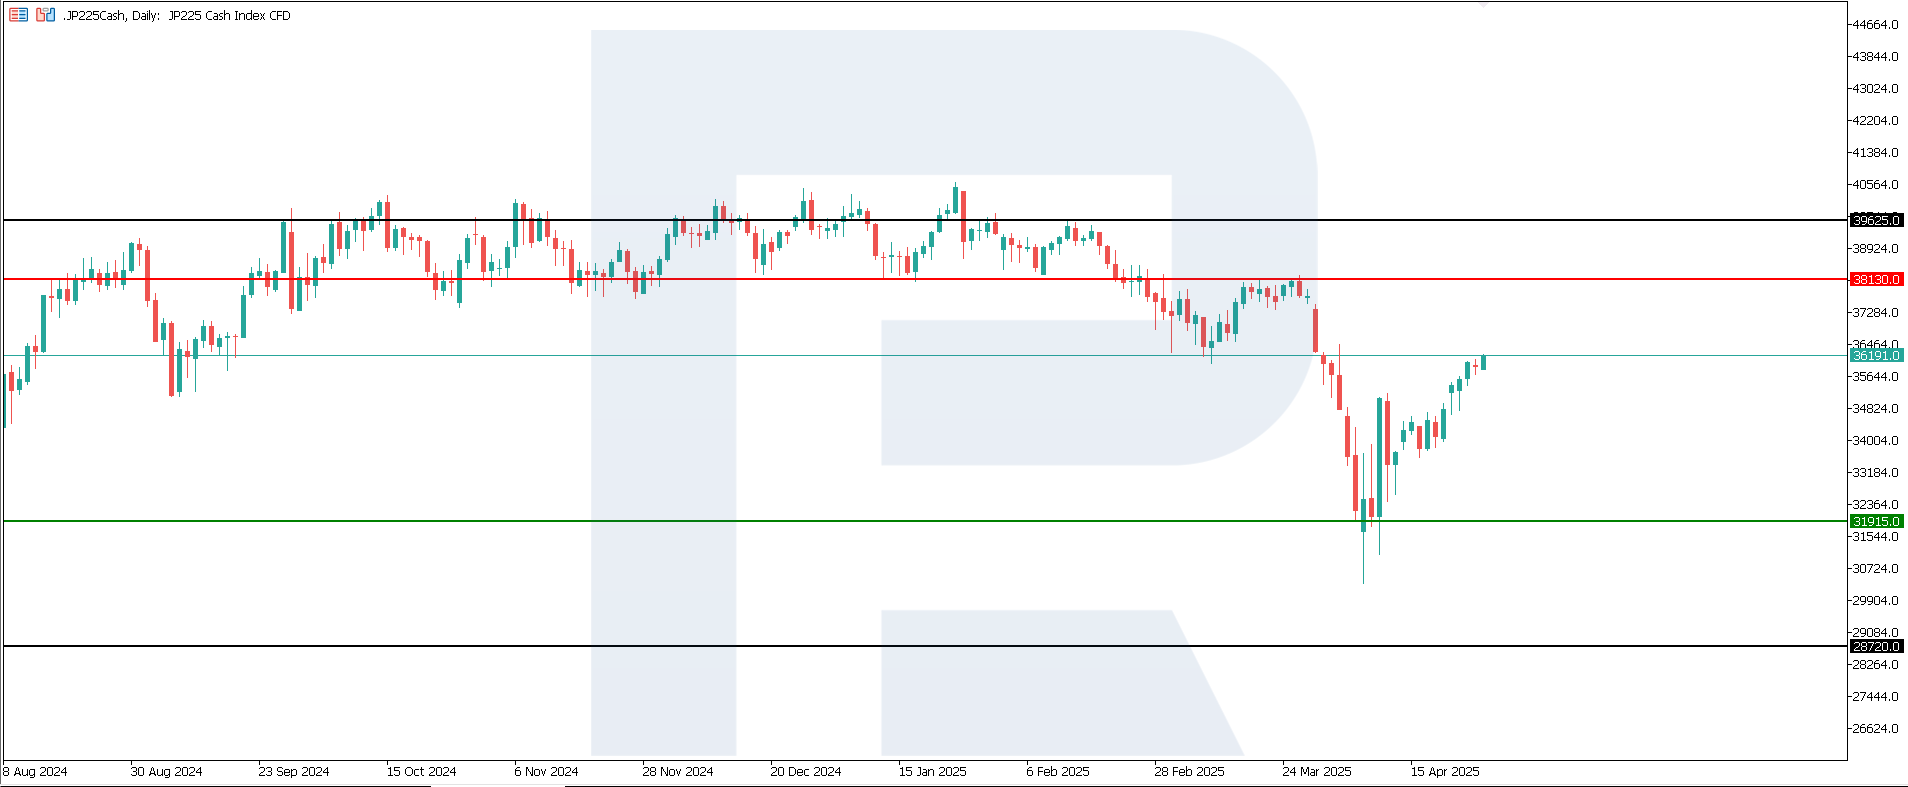
A medium-term sideways channel is the most likely scenario for the JP 225 stock index. The general trend remains downward. However, a false breakout below the 31,915.0 support level is possible, which could trigger a trend reversal. This scenario appears unlikely in the short term.
The following scenarios are considered for the JP 225 price forecast:
- Pessimistic JP 225 forecast: a breakout below the 31,915.0 support level could push the index down to 28,720.0
- Optimistic JP 225 forecast: a breakout above the 38,130.0 resistance level could propel the index to 39,635.0
European index forecast: DE 40
- Recent data: Germany's Ifo Business Climate Index came in at 86.9
- Market impact: improving business climate is traditionally perceived by investors as a positive factor, driving the stock market
Fundamental analysis
Germany's Ifo Business Climate Index is based on surveys of manufacturers, builders, wholesalers, and retailers. Stronger-than-expected index growth signals improving business sentiment in Germany and positive expectations regarding economic activity.
The increase in Germany's Ifo Business Climate Index is a positive factor for the country’s stock market and helps strengthen the shares of most companies focused on domestic demand. Nevertheless, exporters may face certain pressure if the euro strengthens further.
DE 40 technical analysis
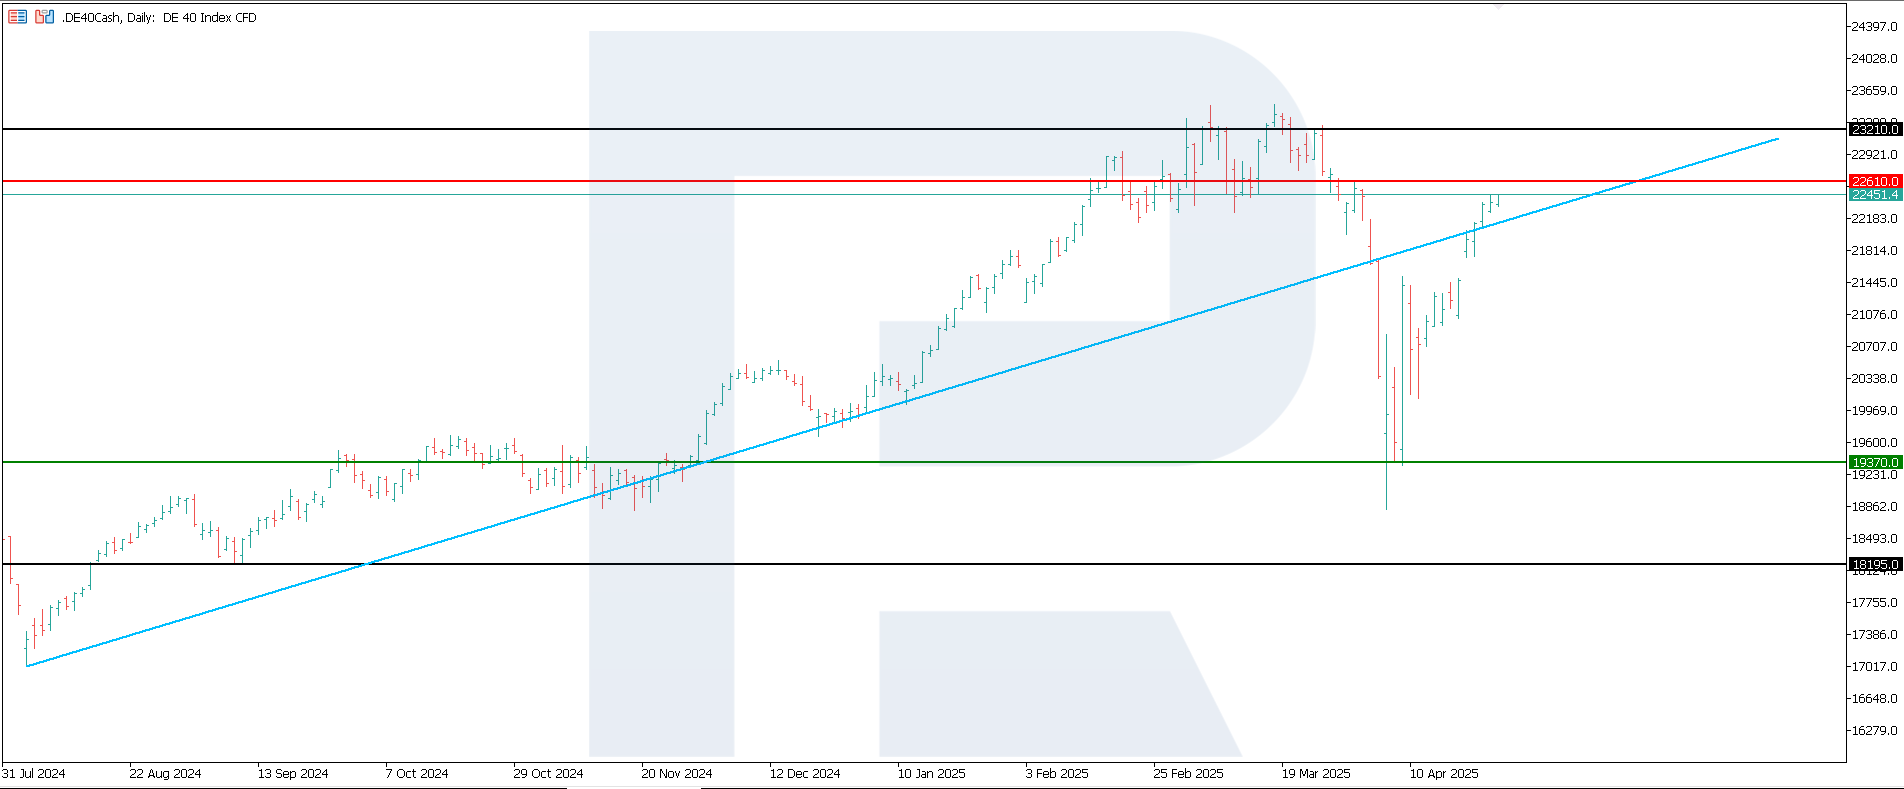
The DE 40 stock index may move sideways if the price fails to break above the 22,610.0 resistance level. The support level formed at 19,370.0, leaving little room for directional growth.
The following scenarios are considered for the DE 40 price forecast:
- Pessimistic DE 40 forecast: a breakout below the 19,370.0 support level could push the index down to 18,195.0
- Optimistic DE 40 forecast: a breakout above the 22,610.0 resistance level could drive the index to 23,210.0
Summary
The US 500 and US Tech indices are the only ones to see upward momentum, with the former completing its best winning streak this year. Investors will await the US labour market data and the next news on the US tariff policy. The JP 225 and DE 40 indices may come under pressure if deals to cut tariffs are not reached. Otherwise, global growth can be expected.
Forecasts presented in this section only reflect the author’s private opinion and should not be considered as guidance for trading. RoboForex bears no responsibility for trading results based on trading recommendations described in these analytical reviews.