Daily technical analysis and forecast for 16 May 2025
Here is a detailed daily technical analysis and forecast for EURUSD, USDJPY, GBPUSD, AUDUSD, USDCAD, XAUUSD and Brent for 16 May 2025.
EURUSD forecast
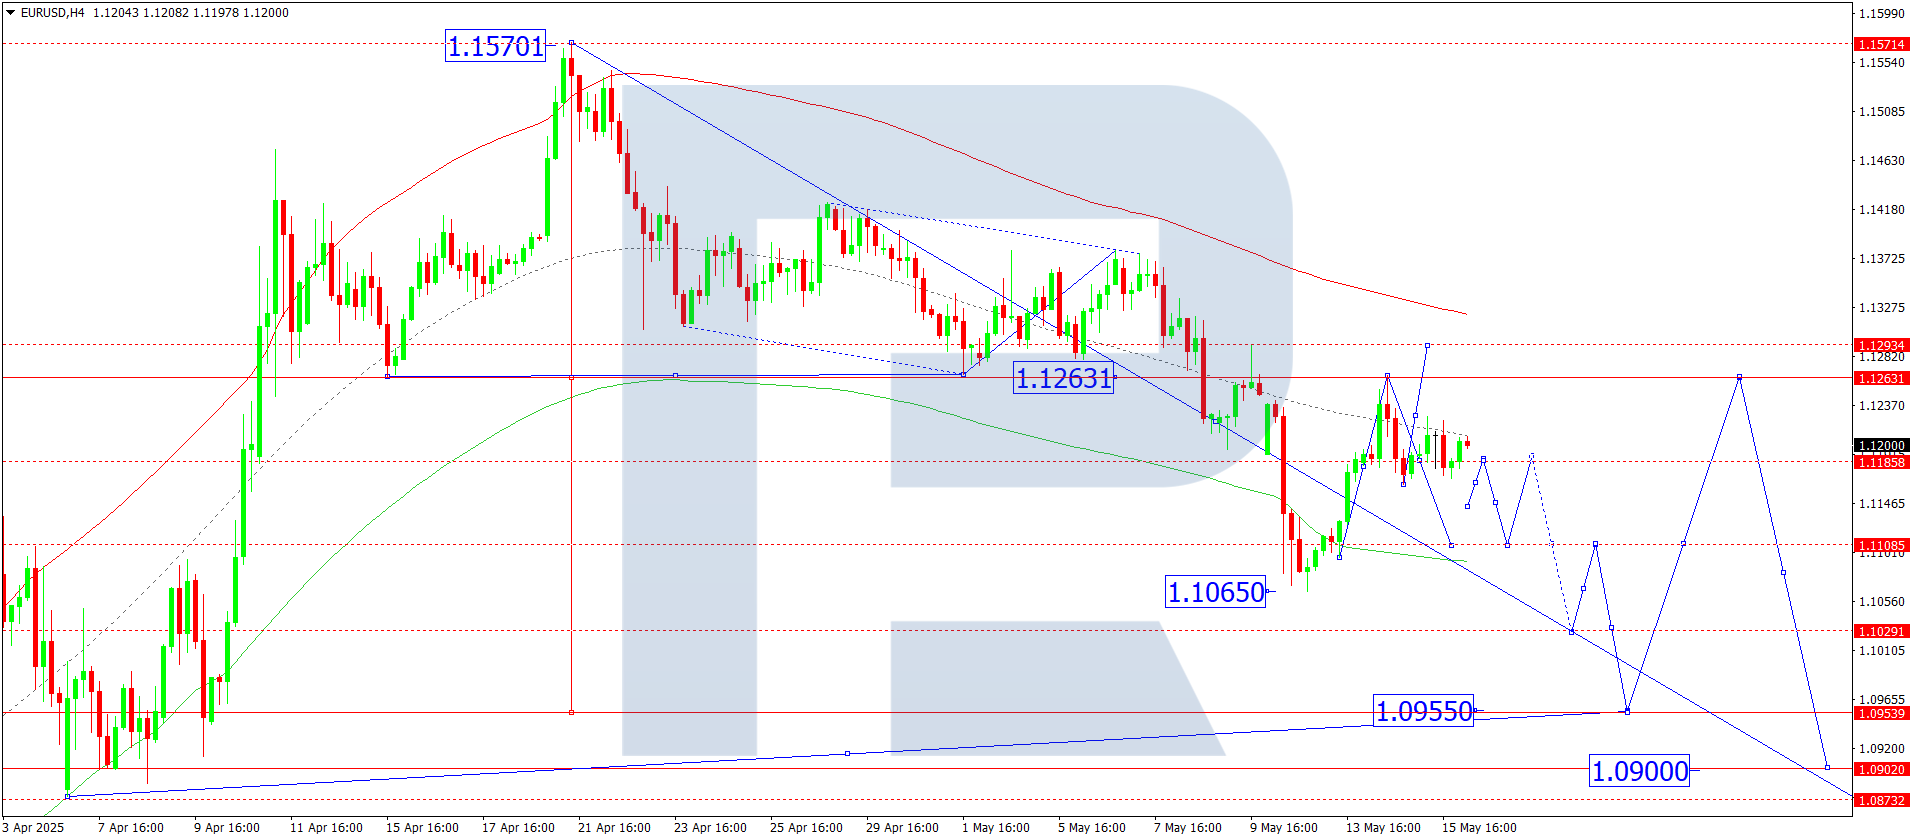
On the H4 chart of EURUSD, the market continues developing a consolidation range around the 1.1180 level. Today, 16 May 2025, if the price breaks upwards, a further correction to 1.1294 is possible. If it breaks downwards, a decline towards 1.1100 may unfold, potentially extending the trend to 1.1030, the local target.
This scenario finds technical confirmation in the Elliott wave structure and the downward wave matrix with a pivot at 1.1263, viewed as key in this wave formation for EURUSD. Currently, a wave is forming towards the lower boundary of the price Envelope at 1.1100. A subsequent rise towards its central line at 1.1180 is possible, followed by a potential continuation of the downward wave to the lower boundary at 1.0955 at minimum.
Technical indicators for today’s EURUSD forecast suggest a downward wave towards 1.1100.
USDJPY forecast
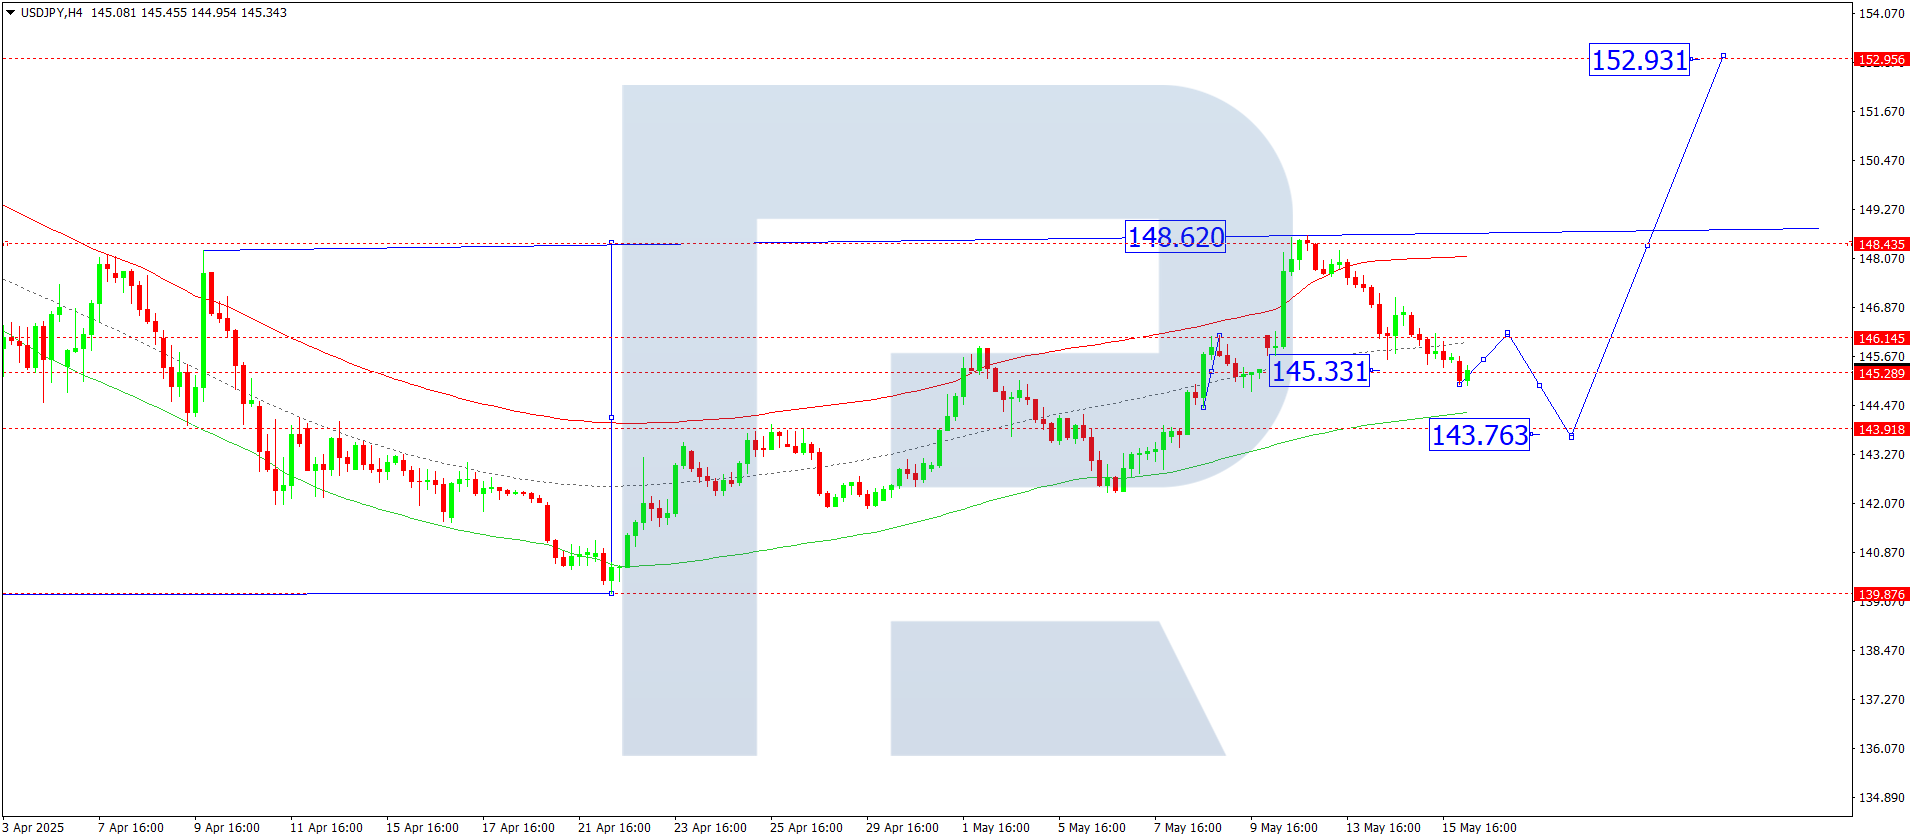
On the H4 chart of USDJPY, the market completed a downward wave to 144.99. Today, 16 May 2025, a potential upward movement to 146.15 (testing from below) is under consideration. The market may form a consolidation range around this level. If it breaks downwards, the correction could extend to 143.76. A breakout to the upside would open the path for a wave towards 148.44 and potentially continue the trend to 152.90, the local target.
This scenario is supported technically by the Elliott wave structure and the upward wave matrix with a pivot at 143.76, seen as key in this wave for USDJPY. The market previously completed the third upward wave to the upper boundary of the price Envelope at 148.64. A correction to the lower boundary at 143.76 is relevant, after which a new upward wave to 148.44 is expected.
Technical indicators for today’s USDJPY forecast suggest a possible correction to 143.76.
GBPUSD forecast
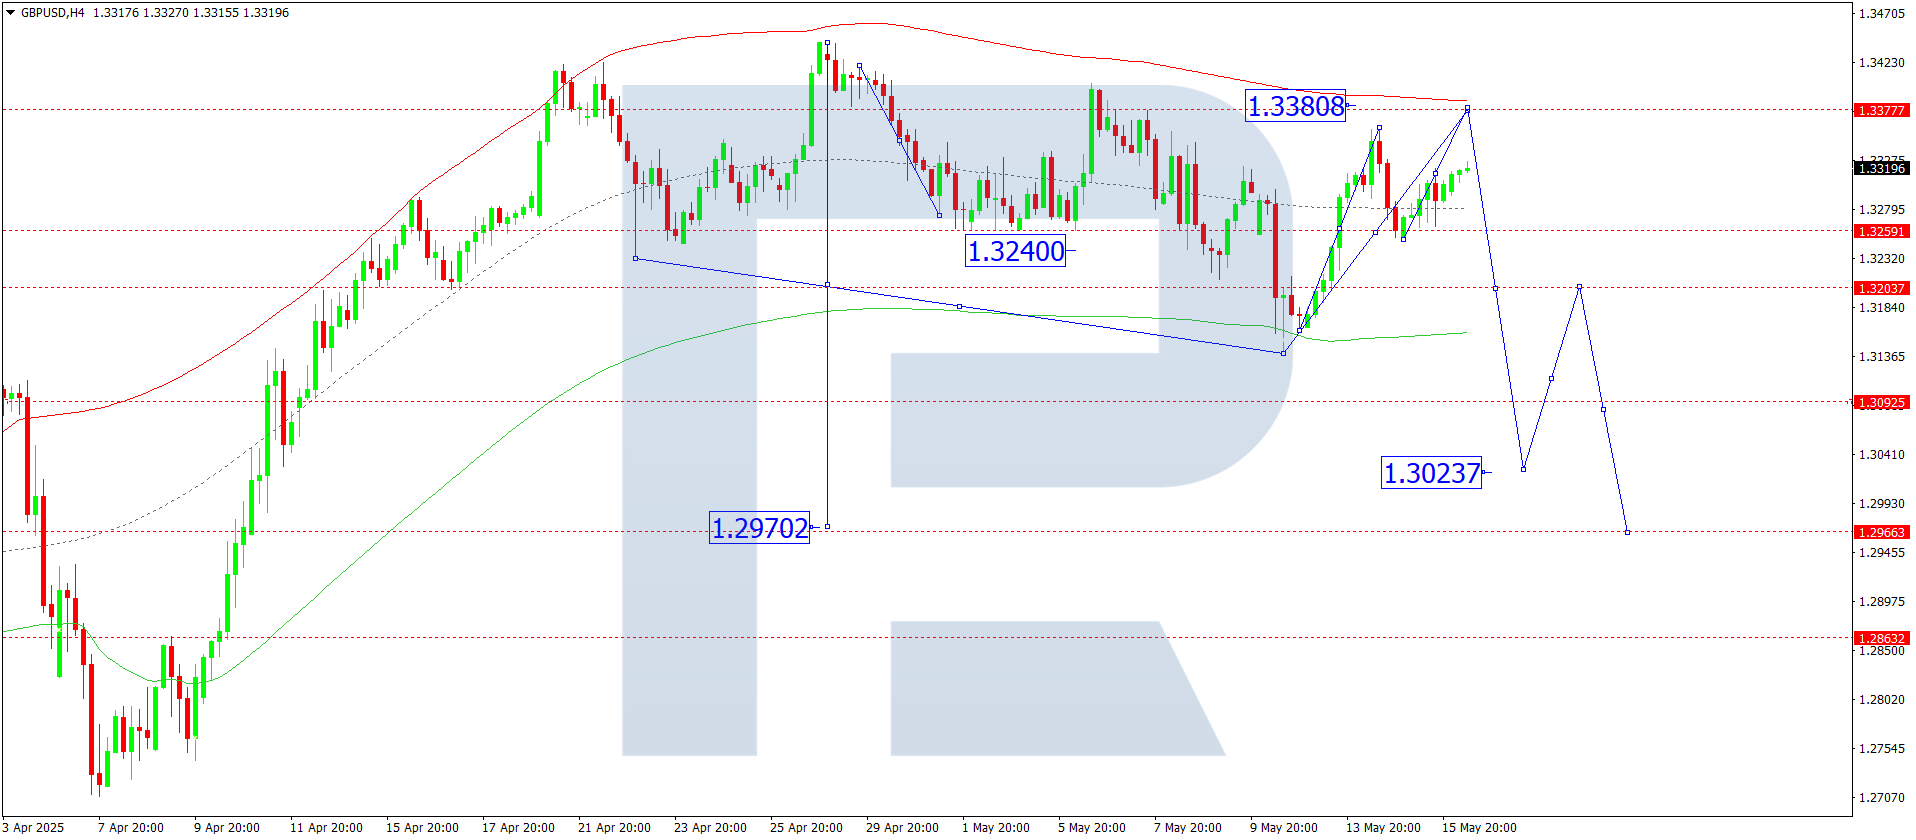
On the H4 chart of GBPUSD, the market continues to consolidate around 1.3260. Today, 16 May 2025, a range expansion to 1.3380 is possible. Afterwards, a new downward wave towards 1.3030 may begin. This is the local target.
This scenario is confirmed by the Elliott wave structure and the downward wave matrix pivoting at 1.3200, viewed as key in this wave structure. The market is currently consolidating around the central line of the price Envelope at 1.3260. A rise to the upper boundary at 1.3380 is possible, followed by a decline to the lower boundary at 1.3030.
Technical indicators for today’s GBPUSD forecast suggest treating the rise as a correction towards 1.3380.
AUDUSD forecast
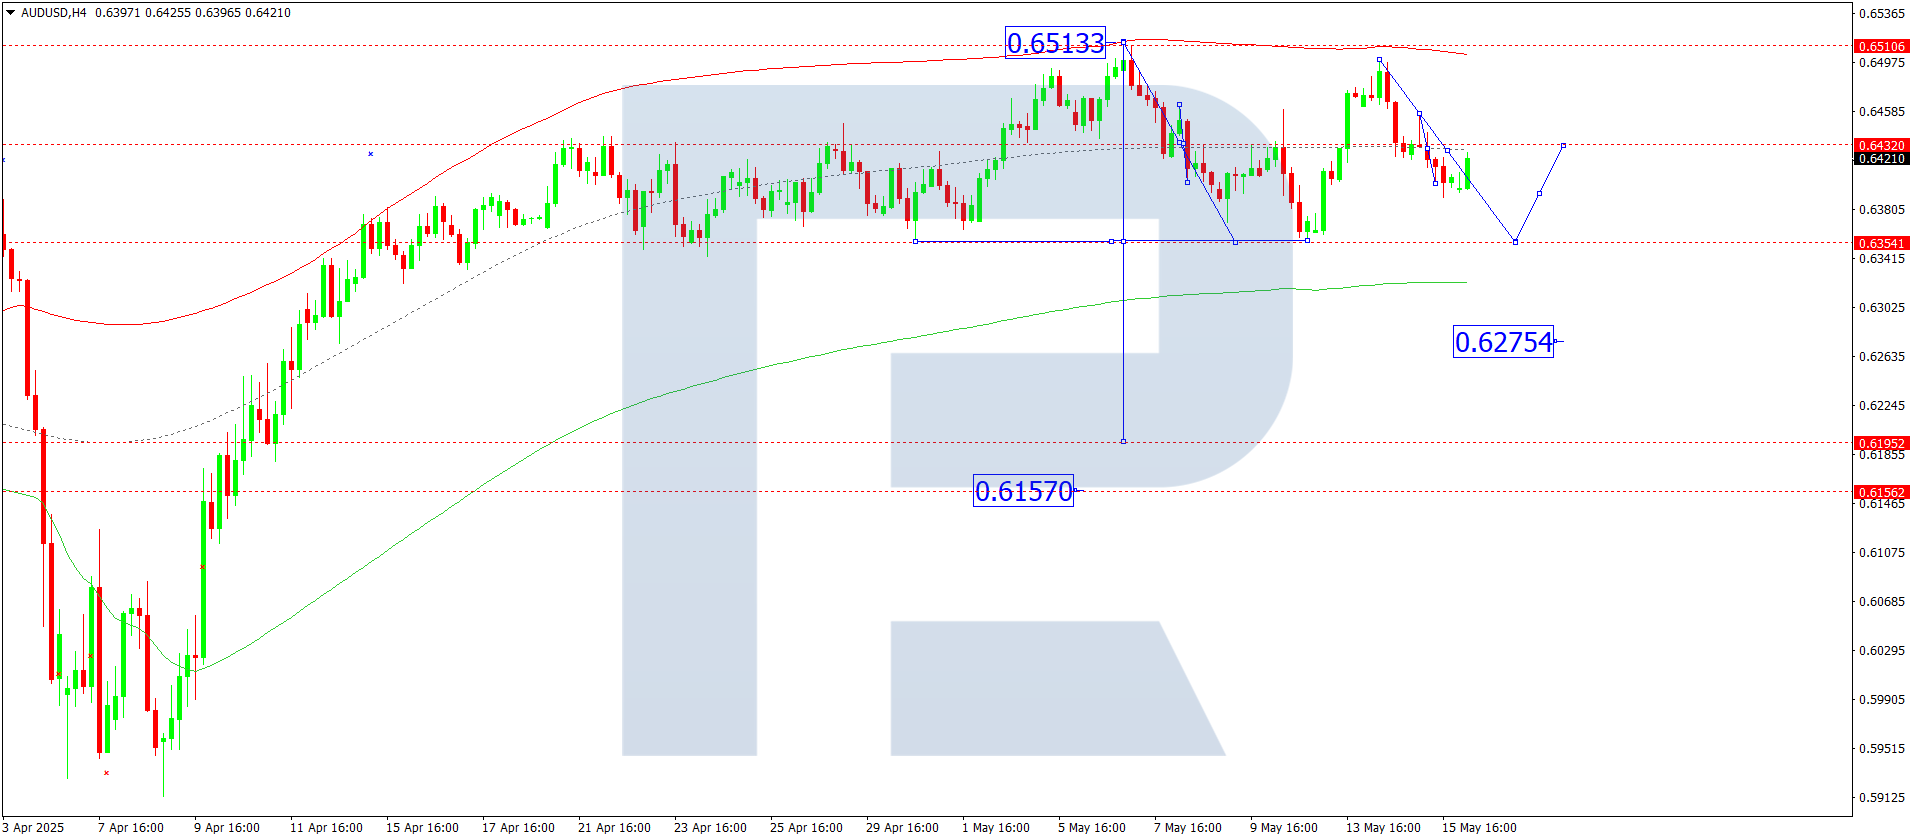
On the H4 chart of AUDUSD, the market continues to form a wide consolidation structure around 0.6432, showing no strong trend. Today, 16 May 2025, the range may expand downwards to 0.6354. Then, a rebound to 0.6432 (tested from below) is possible. A break below the range would open the potential for a further downward wave to 0.6200, the first target.
This scenario aligns with the Elliott wave structure and the downward wave matrix for AUDUSD with a pivot at 0.6432, regarded as key in this wave structure. Currently, the wave is developing towards the lower boundary of the price Envelope at 0.6354. A corrective move back to the central line at 0.6432 remains relevant.
Technical indicators for today’s AUDUSD forecast suggest a likely downward wave towards 0.6355.
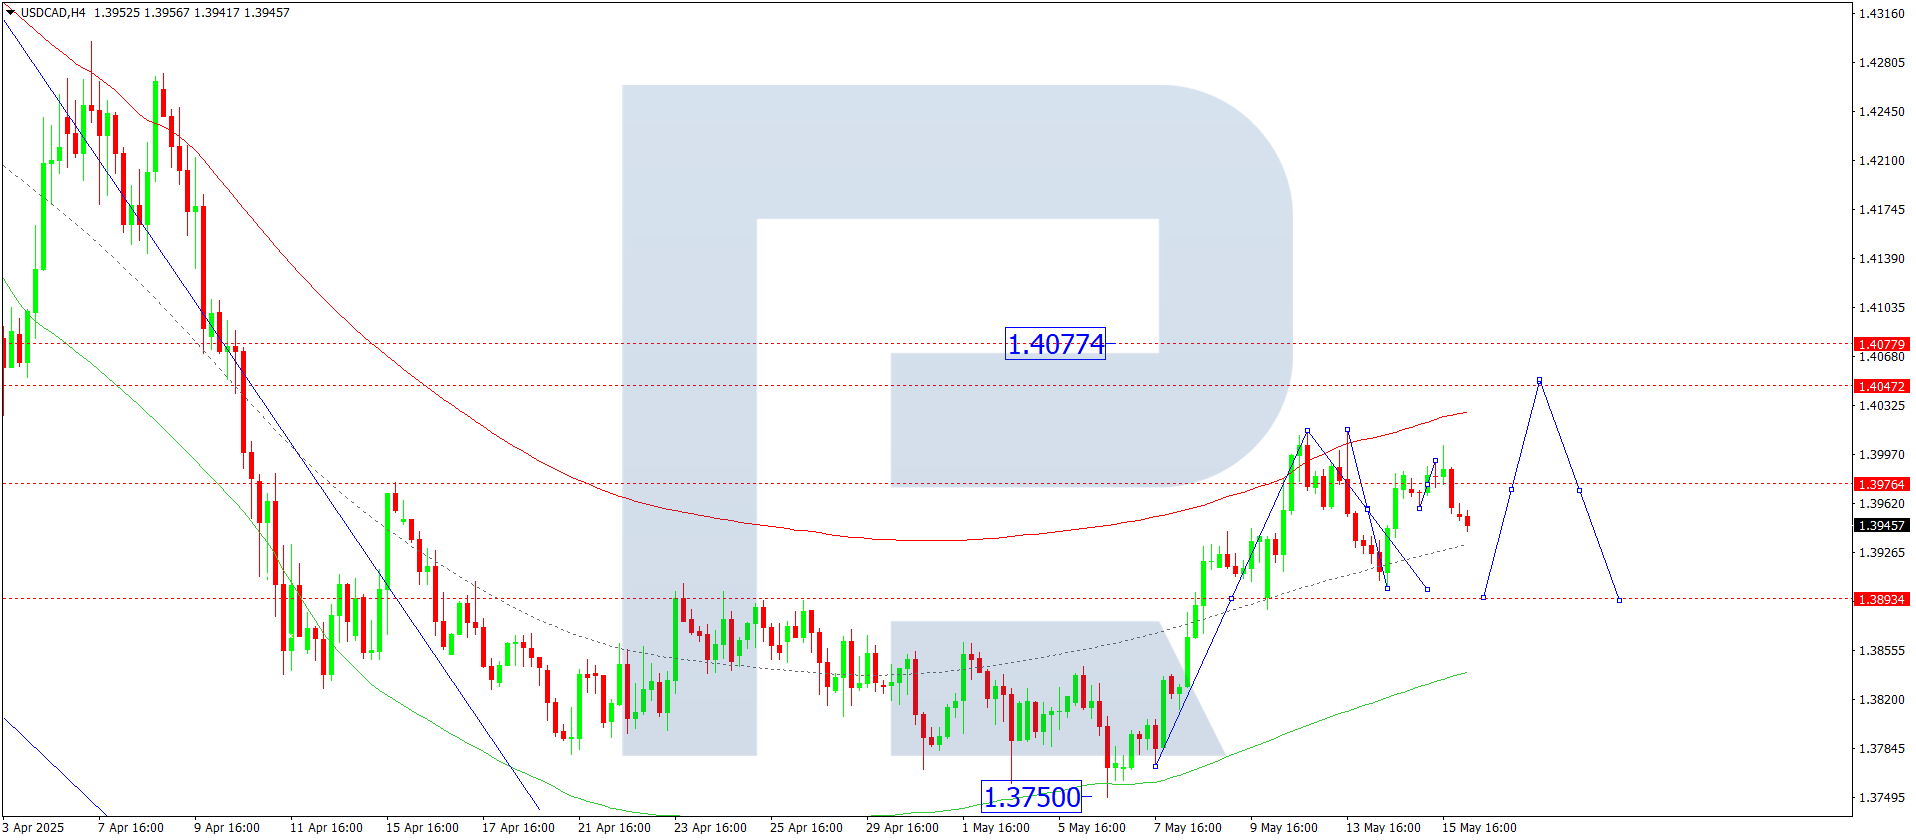
USDCAD forecast
On the H4 chart of USDCAD, the market continues to develop a consolidation range around 1.3958 without a clear trend. Today, 16 May 2025, the price is expected to decline to 1.3894. Afterwards, a new upward wave towards 1.4040 is possible.
This scenario finds support in the Elliott wave structure and the upward wave matrix pivoting at 1.3890, seen as key for USDCAD in this wave formation. The market previously reached the upper boundary of the price Envelope at 1.4012. Currently, a correction to the central line at 1.3894 is likely. After this correction, a new upward wave is expected to start, aiming for the upper boundary at 1.4047.
Technical indicators for today’s USDCAD forecast suggest a corrective downward wave to 1.3894.
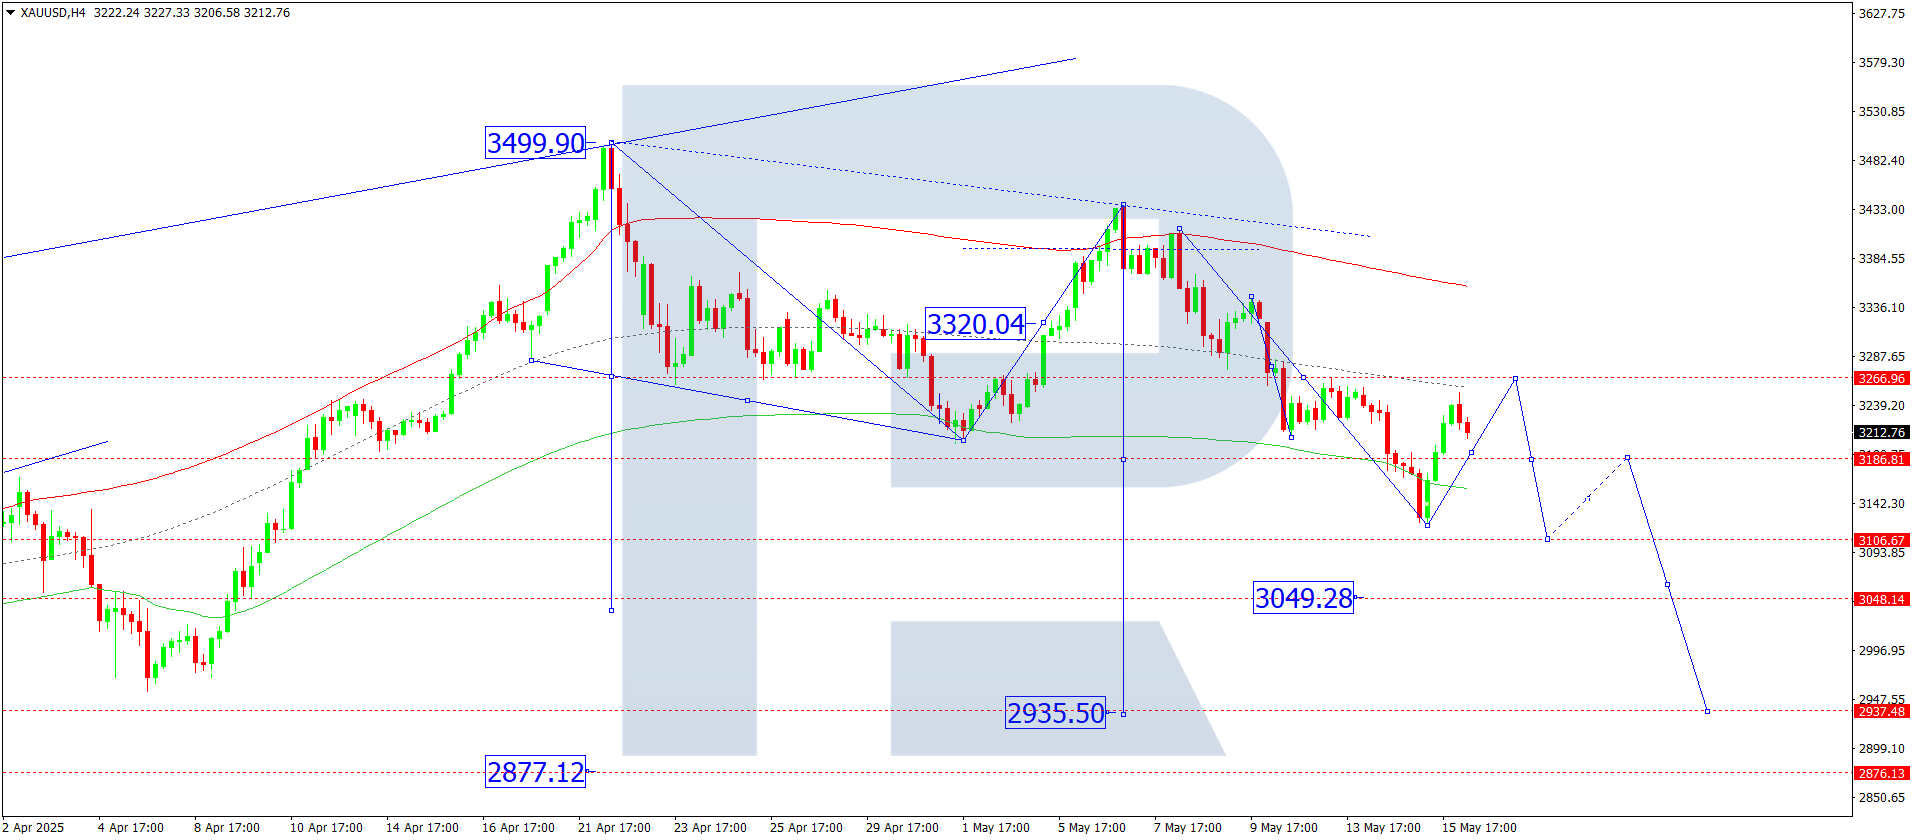
XAUUSD forecast
On the H4 chart of XAUUSD, the market is developing an upward structure towards 3,266. Today, 16 May 2025, prices are expected to reach this target level. Afterwards, a downward wave to 3,100 may follow, with the potential to continue the trend to 2,940.
This scenario is technically confirmed by the Elliott wave structure and the downward wave matrix with a pivot at 3,266, regarded as key in this wave for XAUUSD. Currently, the market is forming an upward wave towards the central line of the price Envelope at 3,266. Then, a downward wave towards the lower boundary at 3,100 may begin.
Technical indicators for today’s XAUUSD forecast suggest a possible decline to 3,100.
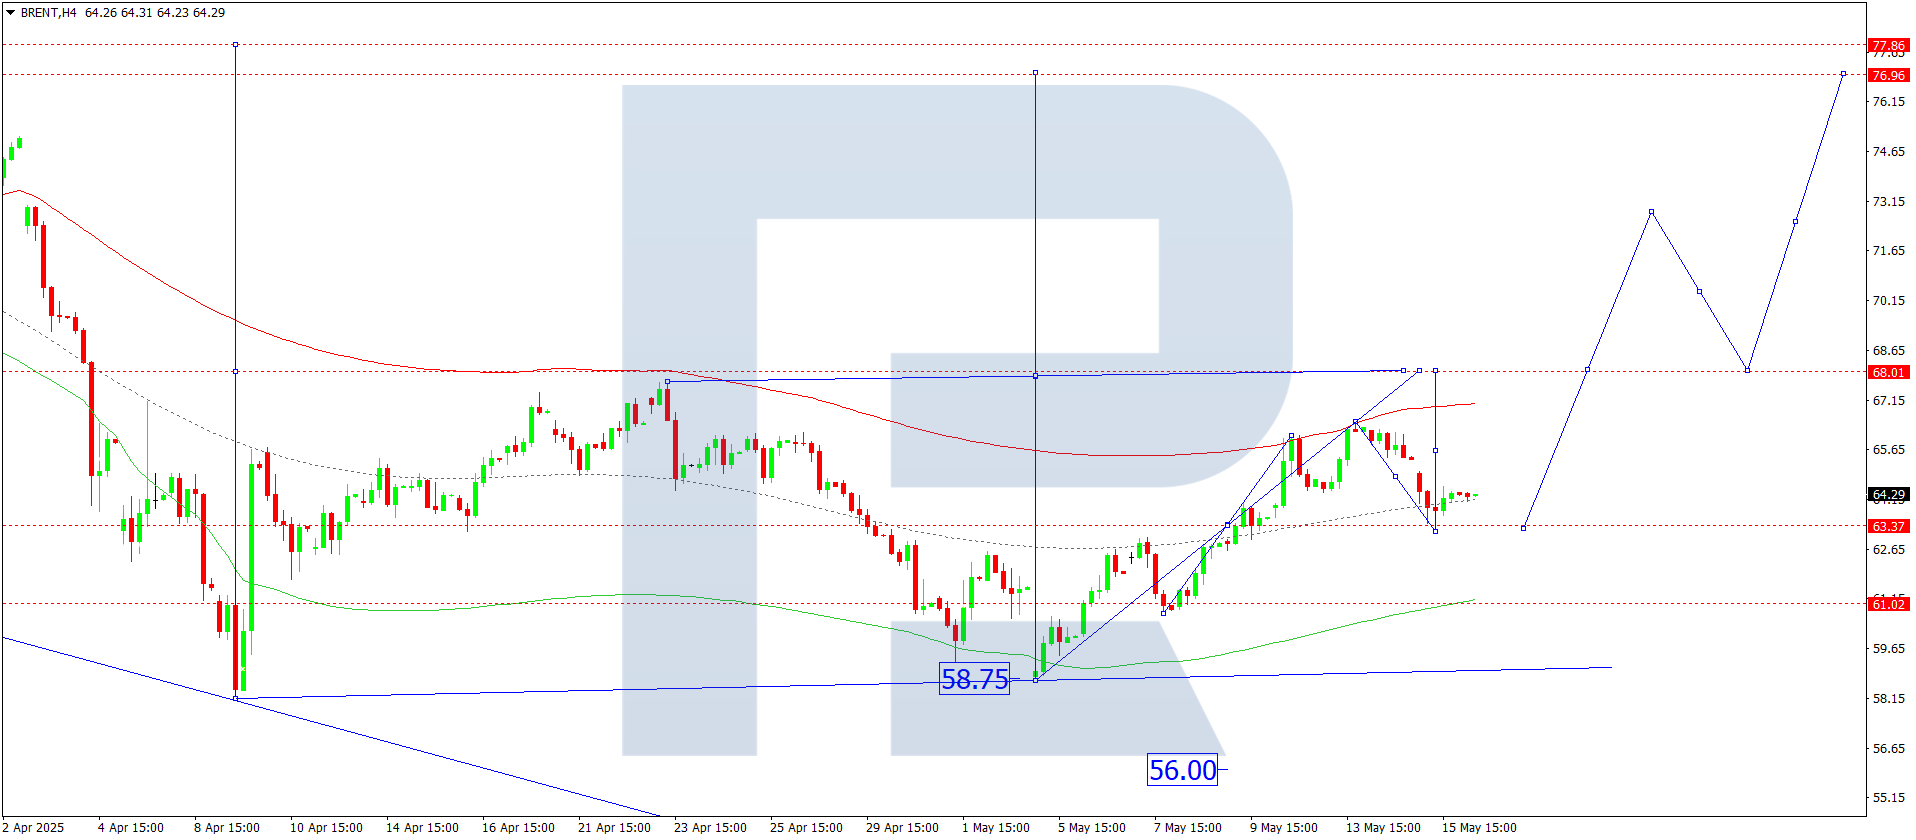
Brent forecast
On the H4 Brent crude chart, the market completed a corrective wave to 63.17. Today, 16 May 2025, a new upward wave could begin, targeting 68.00. A breakout above this level would open the potential for an extended upward wave to 73.20, the local target.
This scenario is confirmed by the Elliott wave structure and the upward wave matrix with a pivot at 63.33, considered key for Brent in this wave. The market has just completed a correction to the central line of the price Envelope at 63.17. A new upward wave to the upper boundary at 68.00 is possible.
Technical indicators in today’s Brent forecast suggest a continued upward wave towards 68.00.
Forecasts presented in this section only reflect the author’s private opinion and should not be considered as guidance for trading. RoboForex bears no responsibility for trading results based on trading recommendations described in these analytical reviews.