Daily technical analysis and forecast for 13 May 2025
Here is a detailed daily technical analysis and forecast for EURUSD, USDJPY, GBPUSD, AUDUSD, USDCAD, XAUUSD and Brent for 13 May 2025.
EURUSD forecast
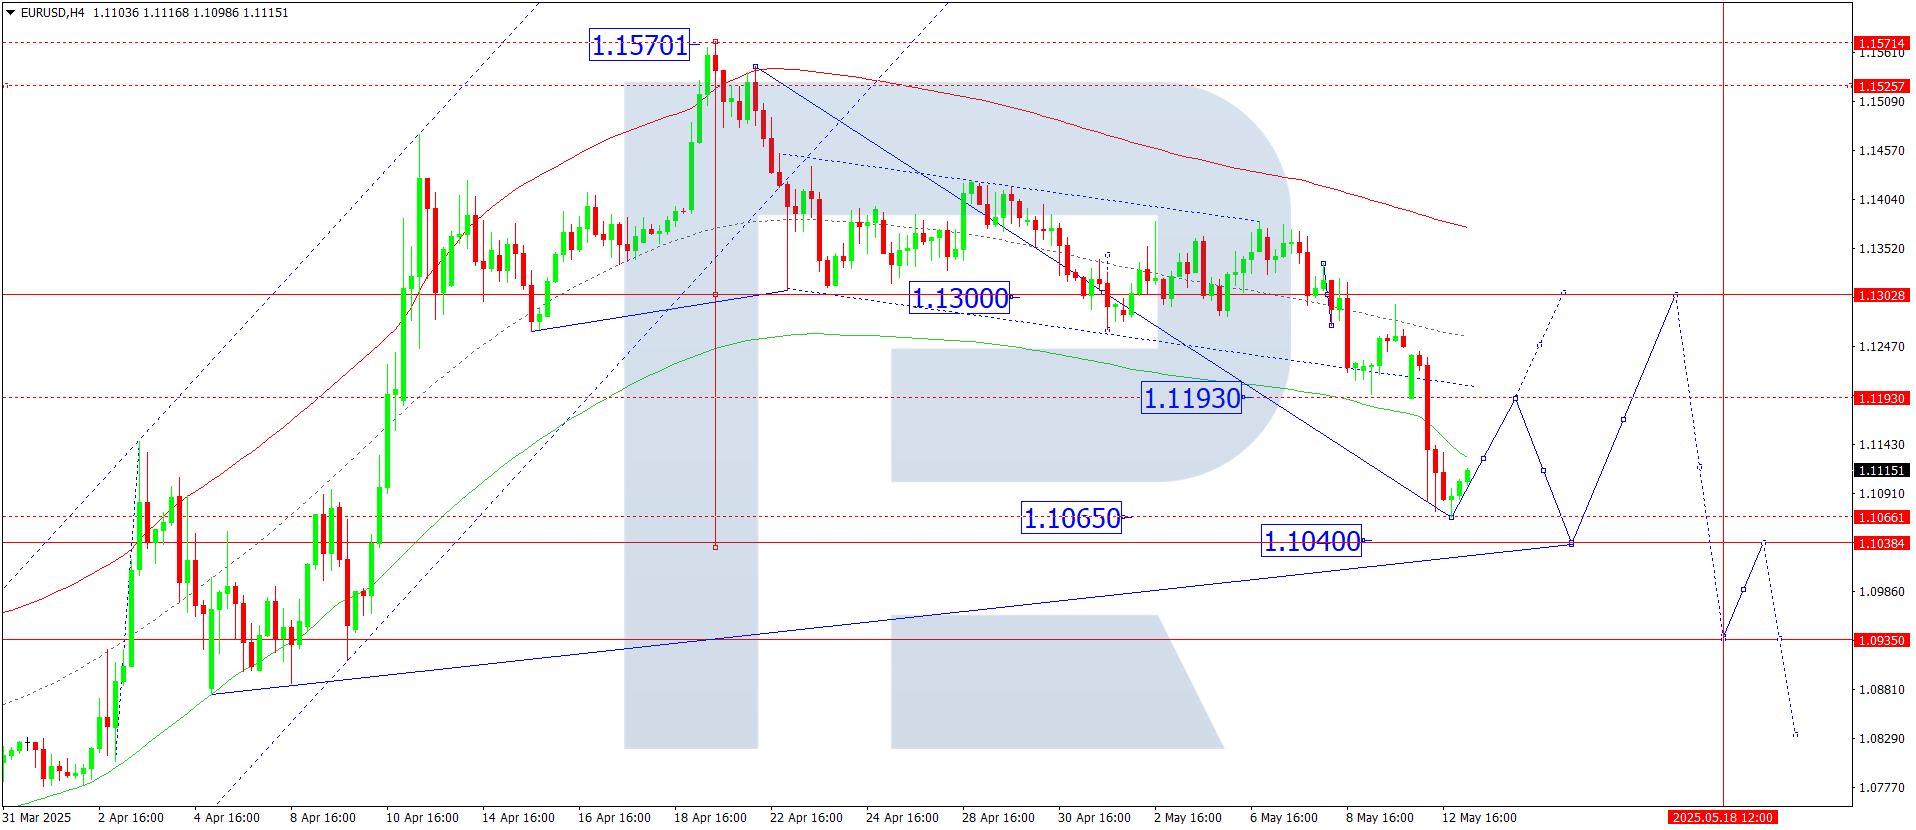
On the H4 chart, EURUSD broke below 1.1190 and reached the local downside target at 1.1060. Today, 13 May 2025, a corrective move to 1.1190 (testing from below) may develop. After that, a new downward wave could start towards 1.1040 at minimum.
This scenario is supported by the Elliott wave structure and the downward wave matrix with a pivot at 1.1300. The price completed a move to the lower boundary of the price Envelope at 1.1060. A rebound to the central line at 1.1190 is expected before the wave may continue to 1.1040.
Technical indicators for today’s EURUSD forecast suggest a corrective rise to 1.1190.
USDJPY forecast
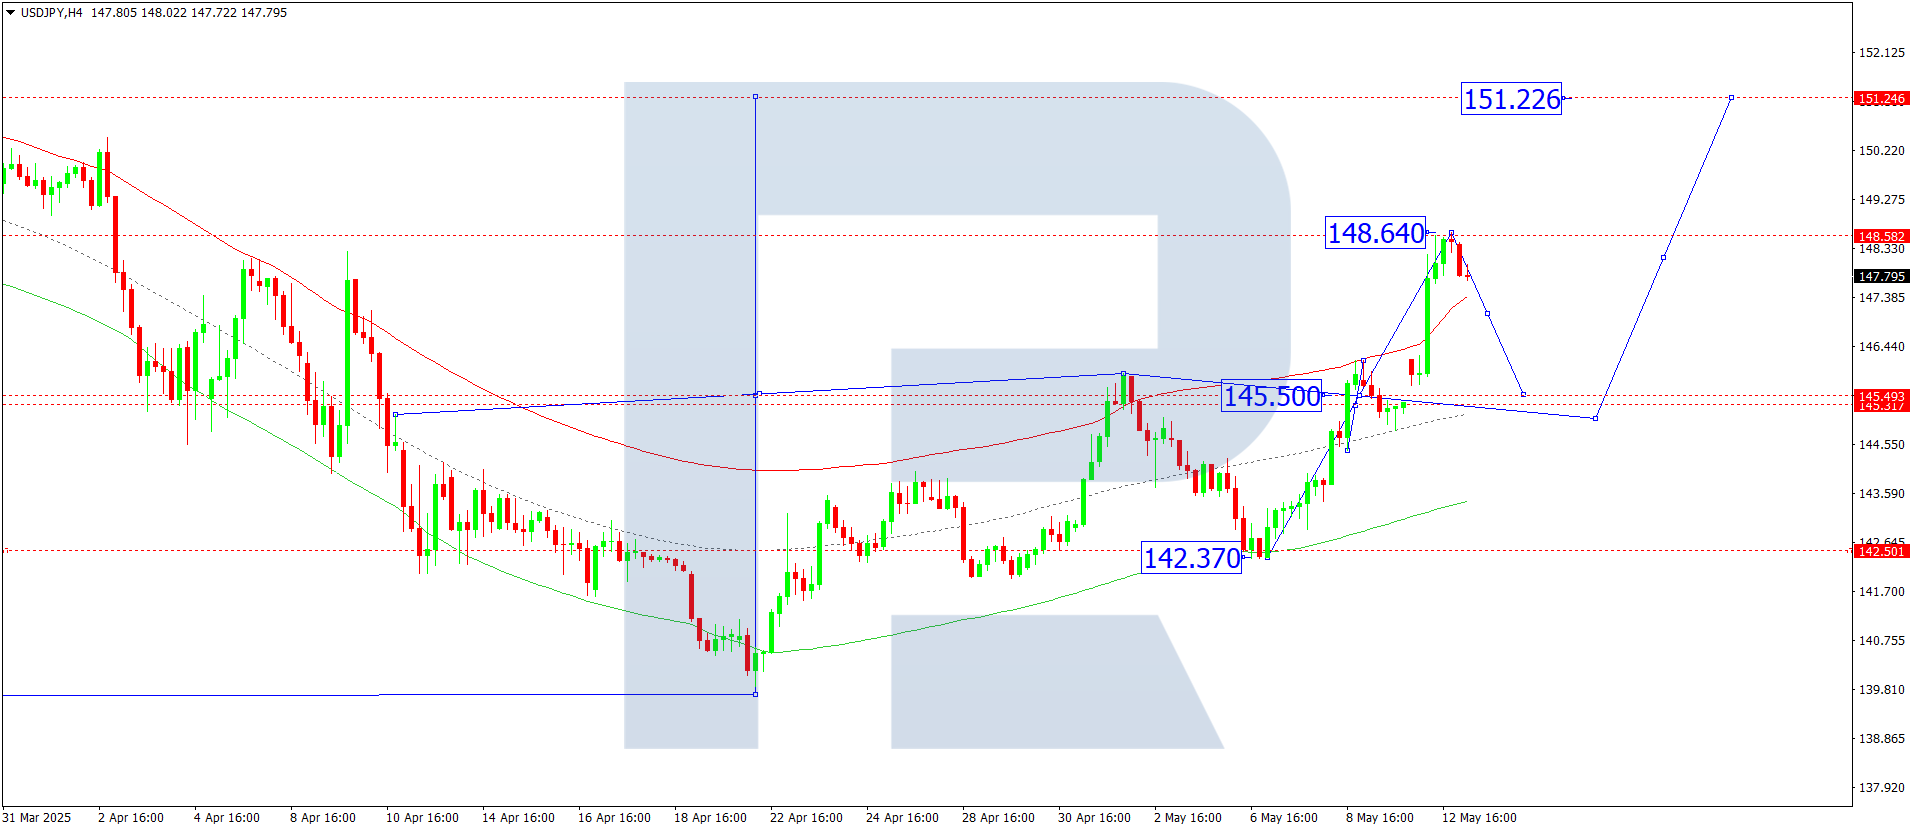
On the H4 chart, USDJPY broke above 145.50 and reached the local target at 148.64. Today, 13 May 2025, a correction to 145.50 (testing from above) is possible. After that, the pair may continue its upward wave towards 151.22.
This outlook is technically supported by the Elliott wave structure and the growth wave matrix with a pivot at 145.50. The market completed the third wave of growth to the upper boundary of the price Envelope at 148.64. A pullback to the central line at 145.50 may follow, with another wave to 151.22 afterwards.
Technical indicators for today’s USDJPY forecast suggest a correction to 145.50.
GBPUSD forecast
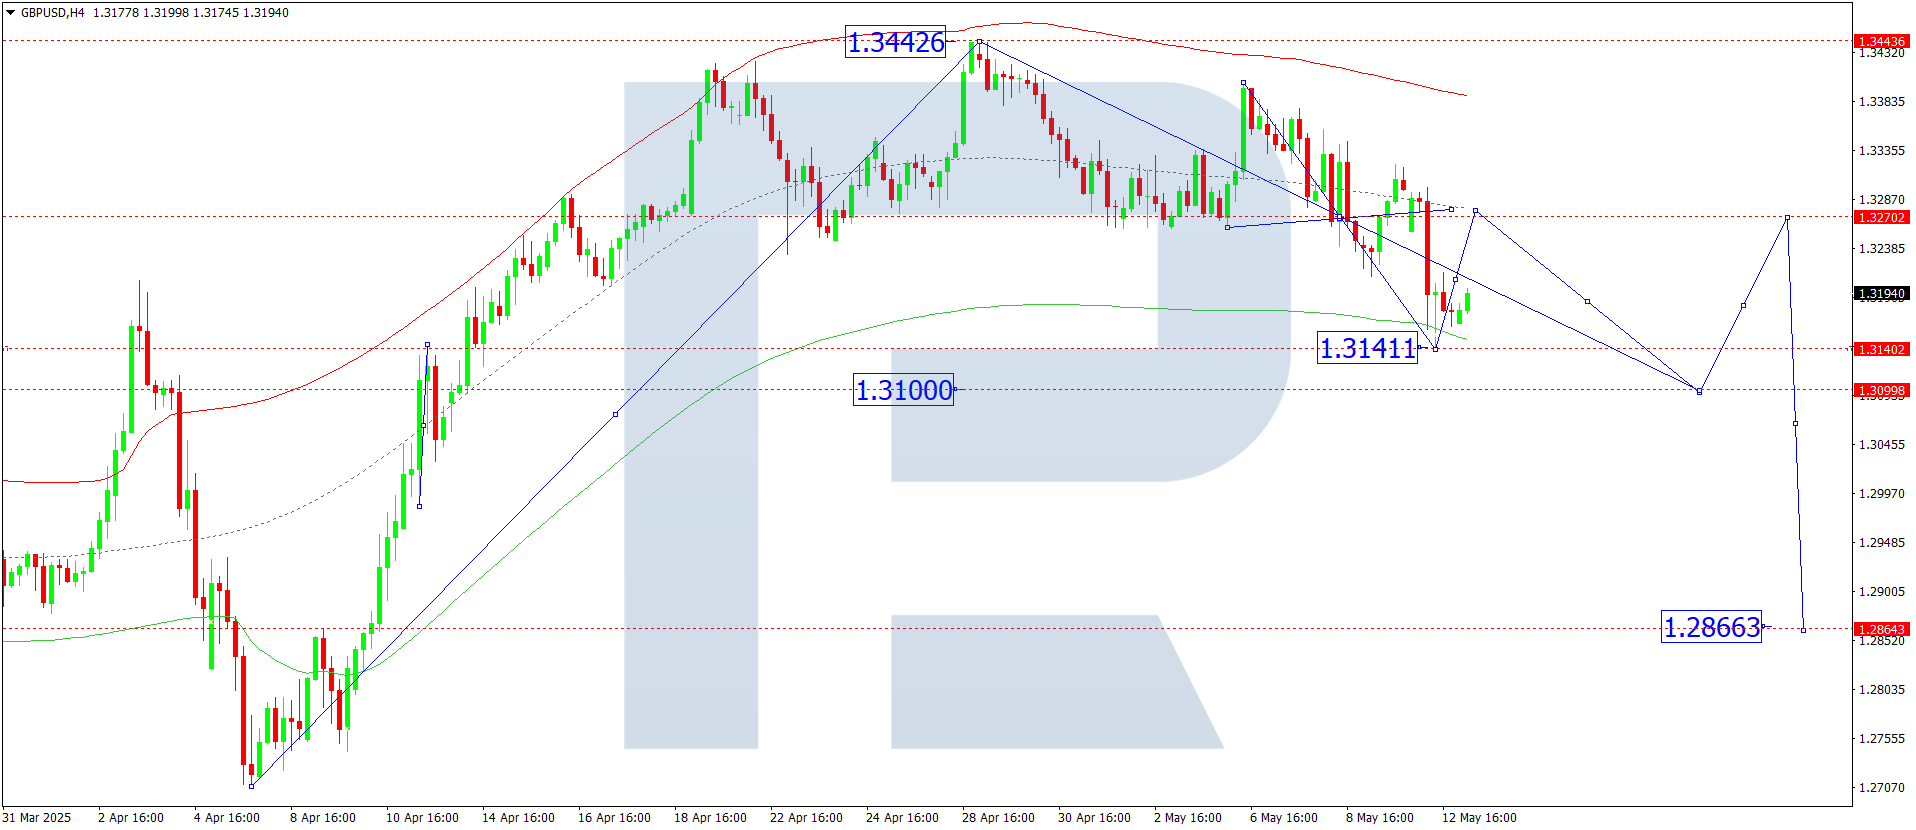
On the H4 chart, GBPUSD broke below 1.3270 and reached the local target at 1.3141. Today, 13 May 2025, a correction to 1.3200 may begin. If the price breaks this level upwards, the correction may extend to 1.3270 (testing from below), followed by a new wave down to 1.3100, the first target.
This scenario is confirmed by the Elliott wave structure and the downward wave matrix with a pivot at 1.3270. The price reached the lower boundary of the price Envelope at 1.3141, and a corrective move to the central line at 1.3270 is likely.
Technical indicators for today’s GBPUSD forecast suggest a correction towards 1.3270.
AUDUSD forecast
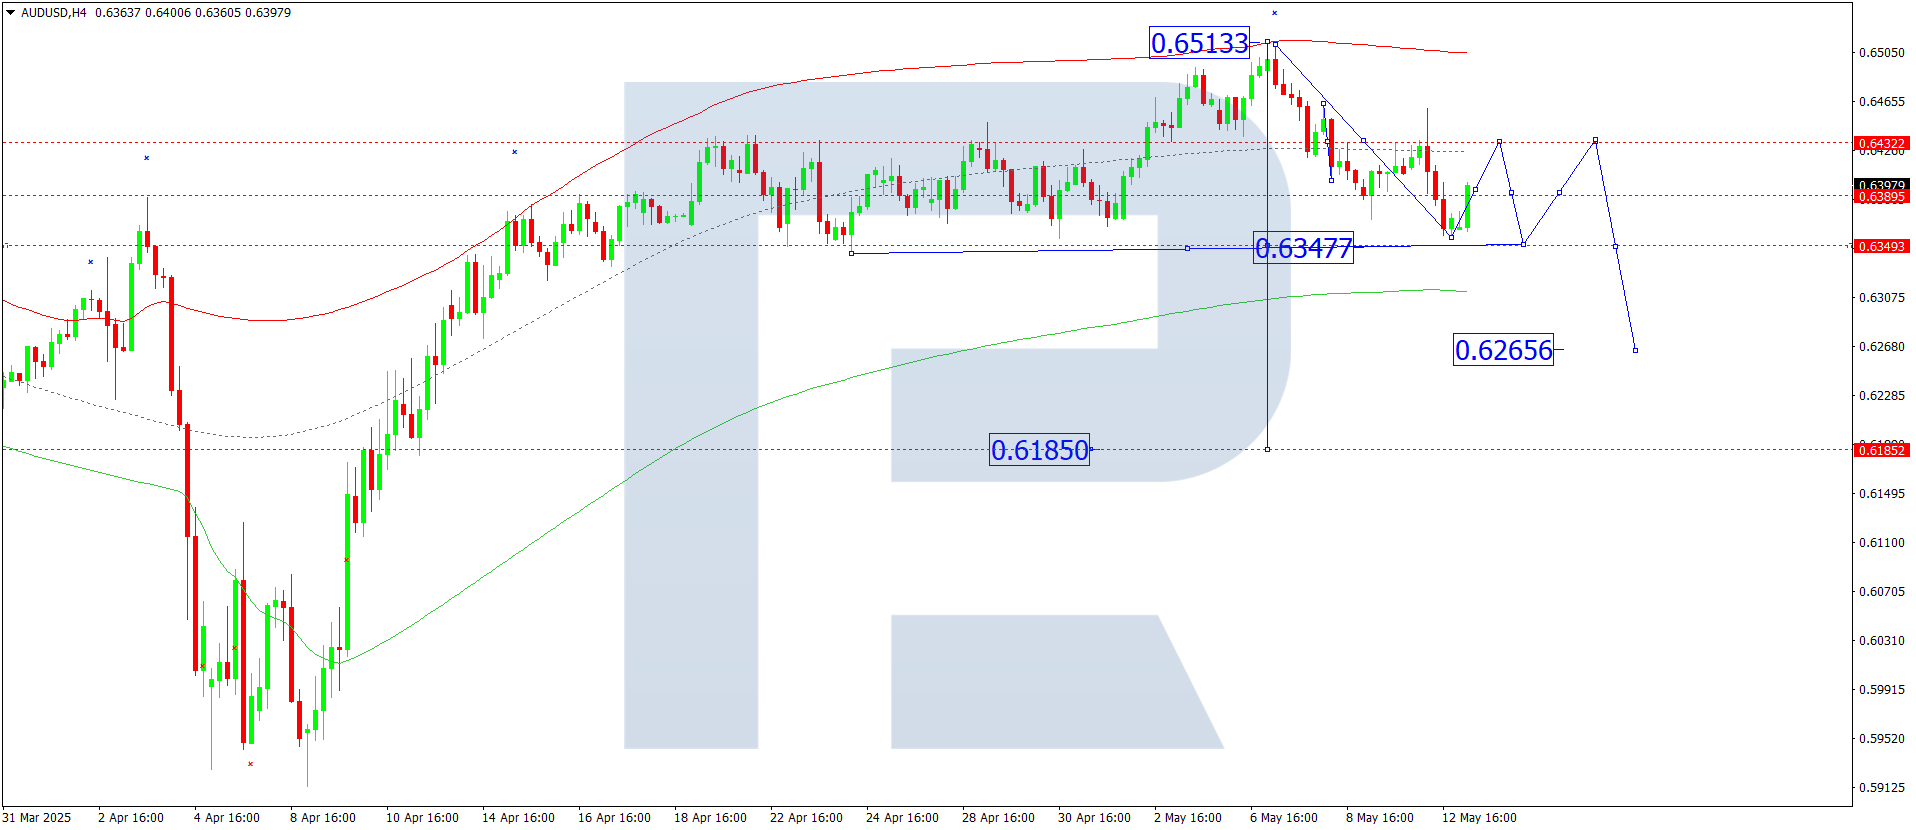
On the H4 chart, AUDUSD completed a downward wave to 0.6356. Today, 13 May 2025, a correction to 0.6433 is expected. Afterwards, a new downward wave towards 0.6347 may start. If this level breaks, the trend could continue to 0.6265, the local target.
This forecast is confirmed by the Elliott wave structure and the downward wave matrix with a pivot at 0.6433. The price is moving toward the lower boundary of the price Envelope at 0.6347, with a possible bounce to the central line at 0.6433.
Technical indicators for today’s AUDUSD forecast suggest a corrective rise to 0.6433.
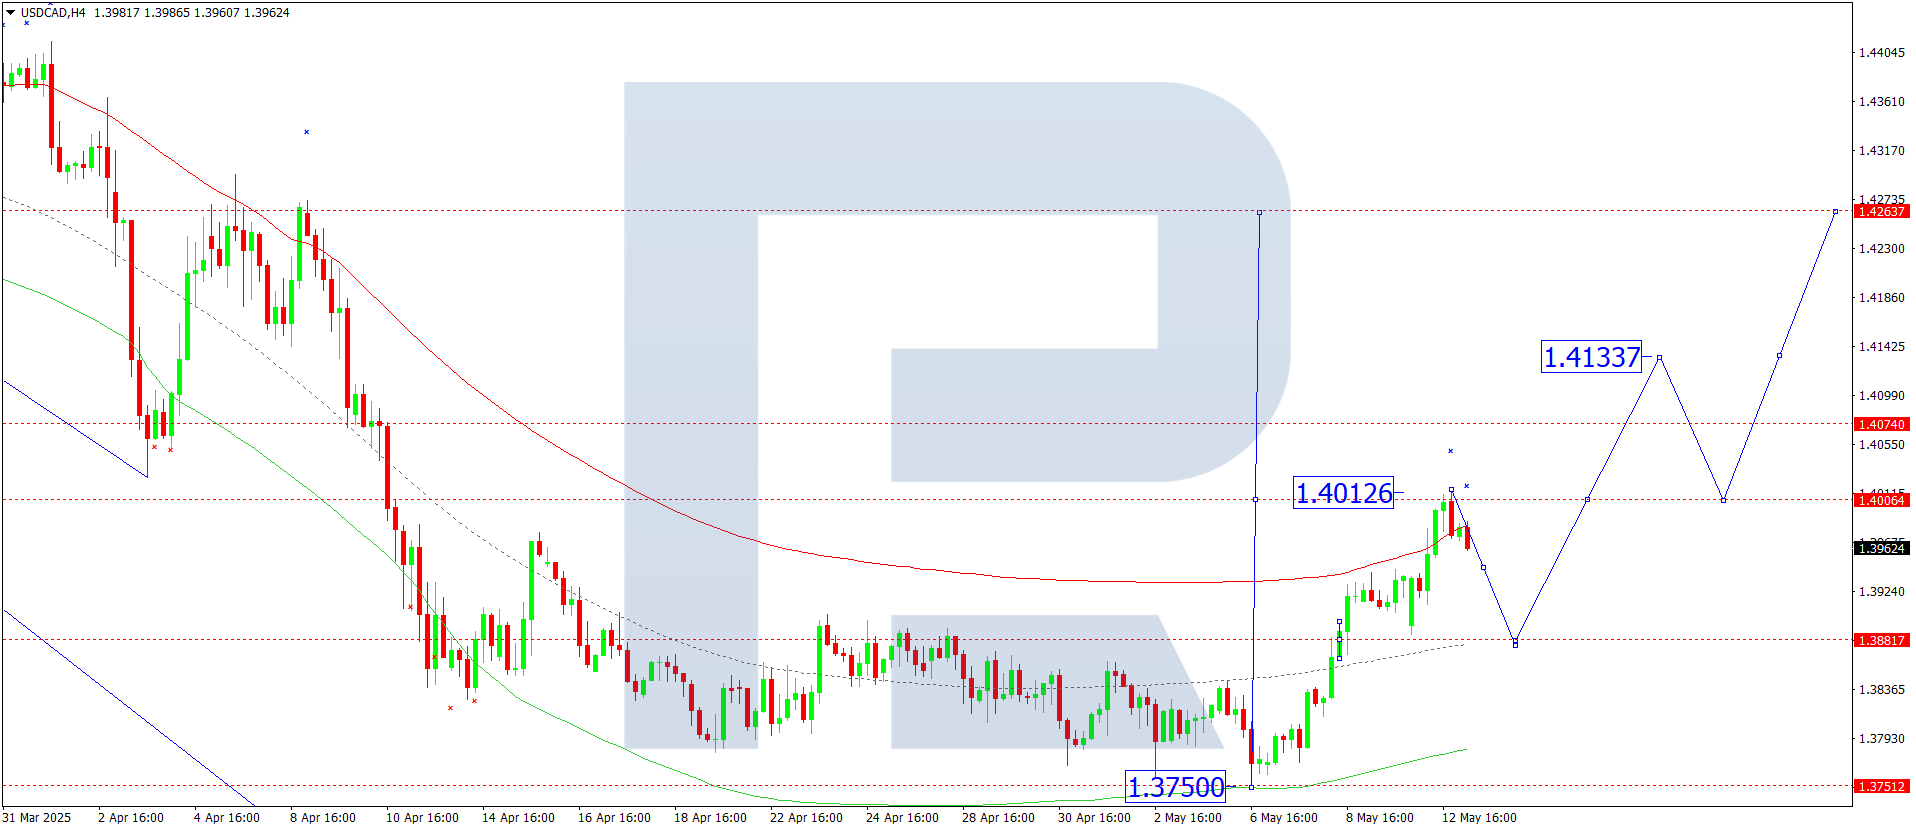
USDCAD forecast
On the H4 chart, USDCAD completed a growth wave to 1.4012. Today, 13 May 2025, a correction to 1.3880 is expected. After that, another upward wave may develop towards 1.4133.
This scenario is confirmed by the Elliott wave structure and the growth wave matrix with a pivot at 1.3880. The market reached the upper boundary of the price Envelope at 1.4012 and may now pull back to the central line at 1.3880 before resuming the uptrend.
Technical indicators for today’s USDCAD forecast suggest a corrective decline to 1.3880.
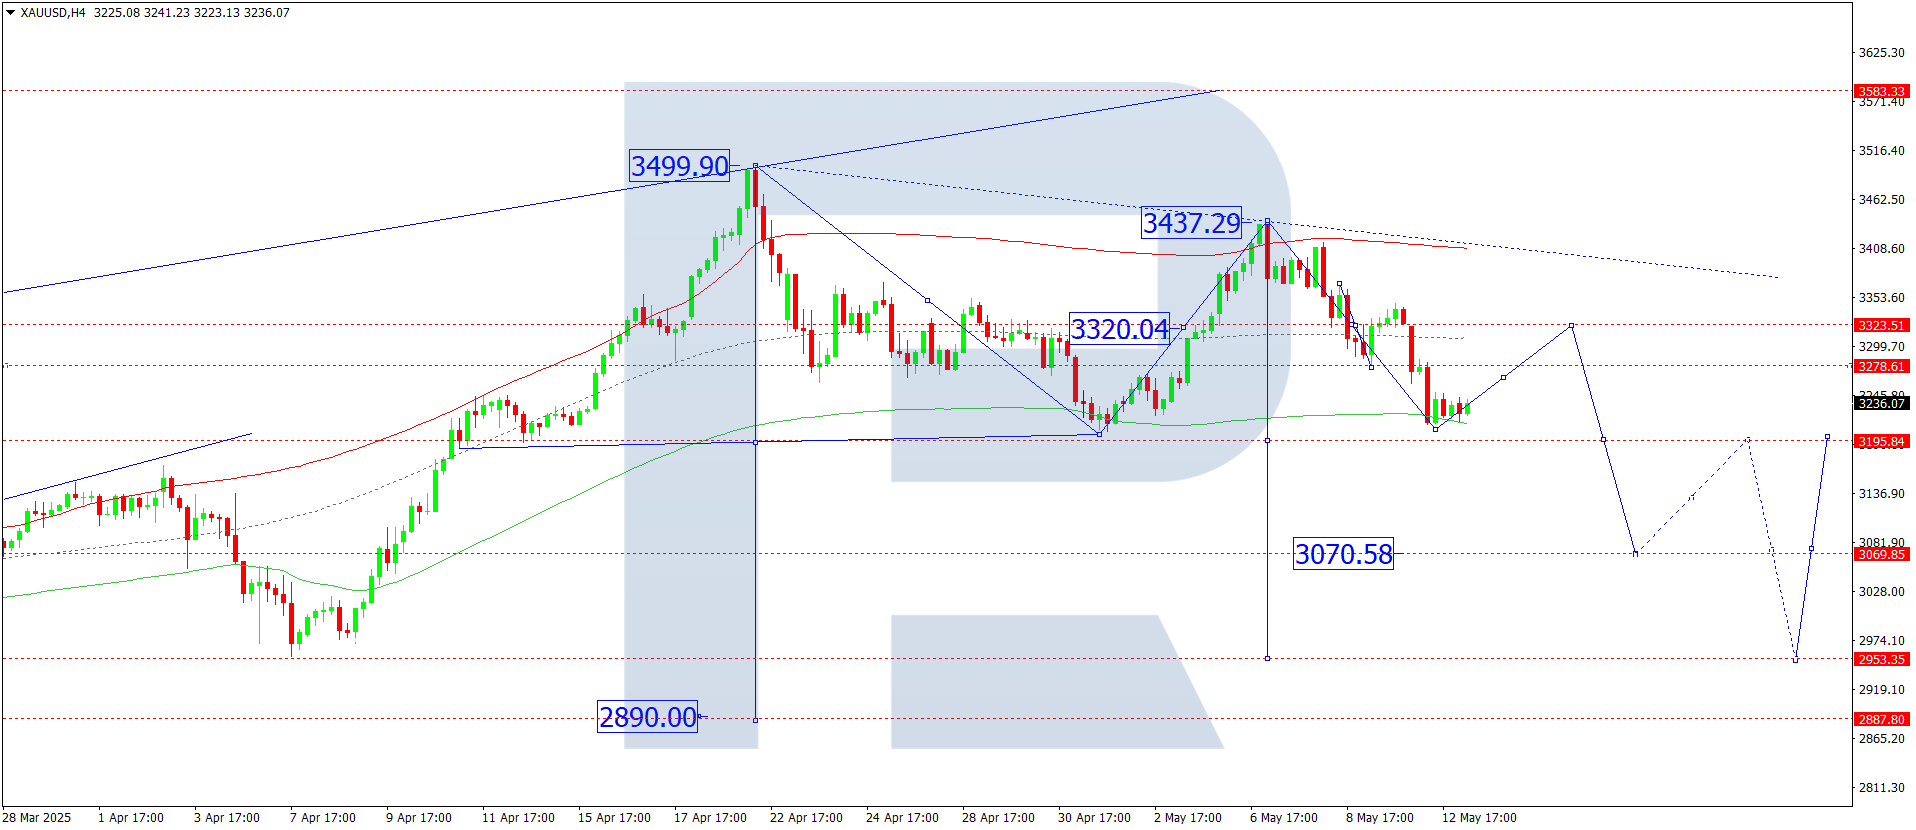
XAUUSD forecast
On the H4 chart, XAUUSD completed a downward wave to 3,207. Today, 13 May 2025, a correction to 3,320 (testing from below) is expected. After that, the downward wave may continue to 3,070, a local target.
This scenario is confirmed by the Elliott wave structure and the downward wave matrix with a pivot at 3,320. The market has reached the lower boundary of the price Envelope at 3,207 and may now form a corrective wave to the central line at 3,320.
Technical indicators for today’s XAUUSD forecast suggest a rise towards 3,320.
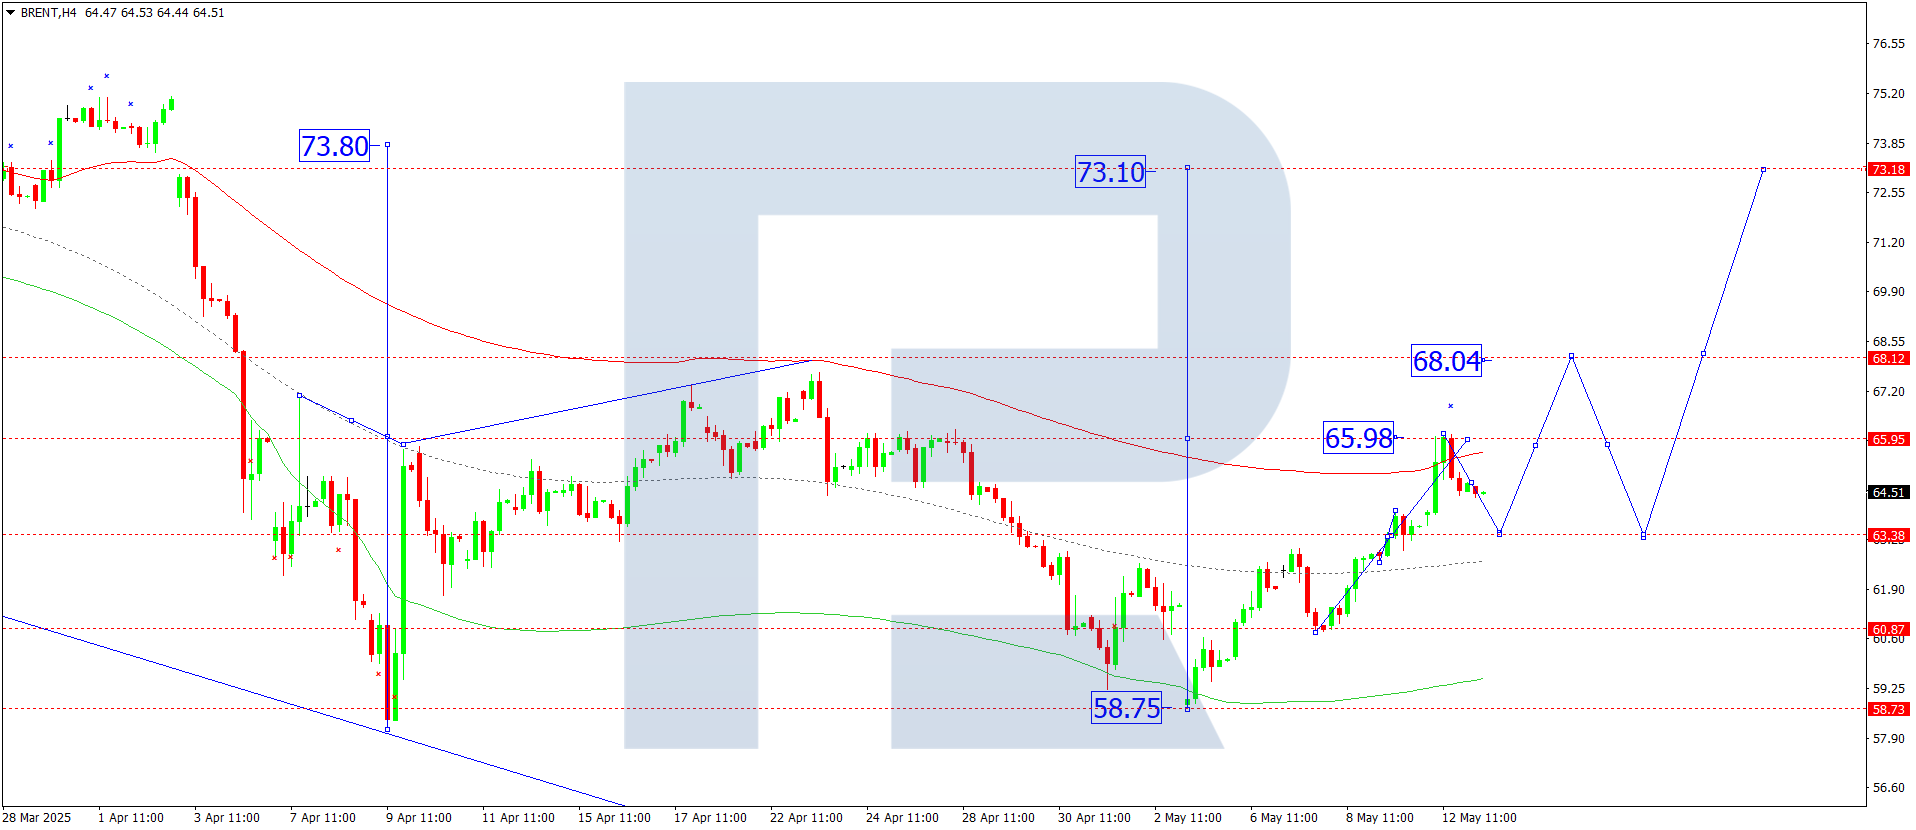
Brent forecast
On the H4 chart, Brent broke above 63.38 and reached the growth target at 65.98. Today, 13 May 2025, a corrective wave to 63.38 (testing from above) may begin. After that, the price may rise again to 68.04. If this level is broken, the trend could continue to 73.20, a local target.
This forecast is technically supported by the Elliott wave structure and the downward wave matrix with a pivot at 63.38. The price reached the upper boundary of the price Envelope at 65.98, and a correction to the central line at 63.83 may follow.
Technical indicators for today’s Brent forecast suggest the start of a correction to 63.38.
Forecasts presented in this section only reflect the author’s private opinion and should not be considered as guidance for trading. RoboForex bears no responsibility for trading results based on trading recommendations described in these analytical reviews.