Daily technical analysis and forecast for 12 May 2025
Here is a detailed daily technical analysis and forecast for EURUSD, USDJPY, GBPUSD, AUDUSD, USDCAD, XAUUSD and Brent for 12 May 2025.
EURUSD forecast
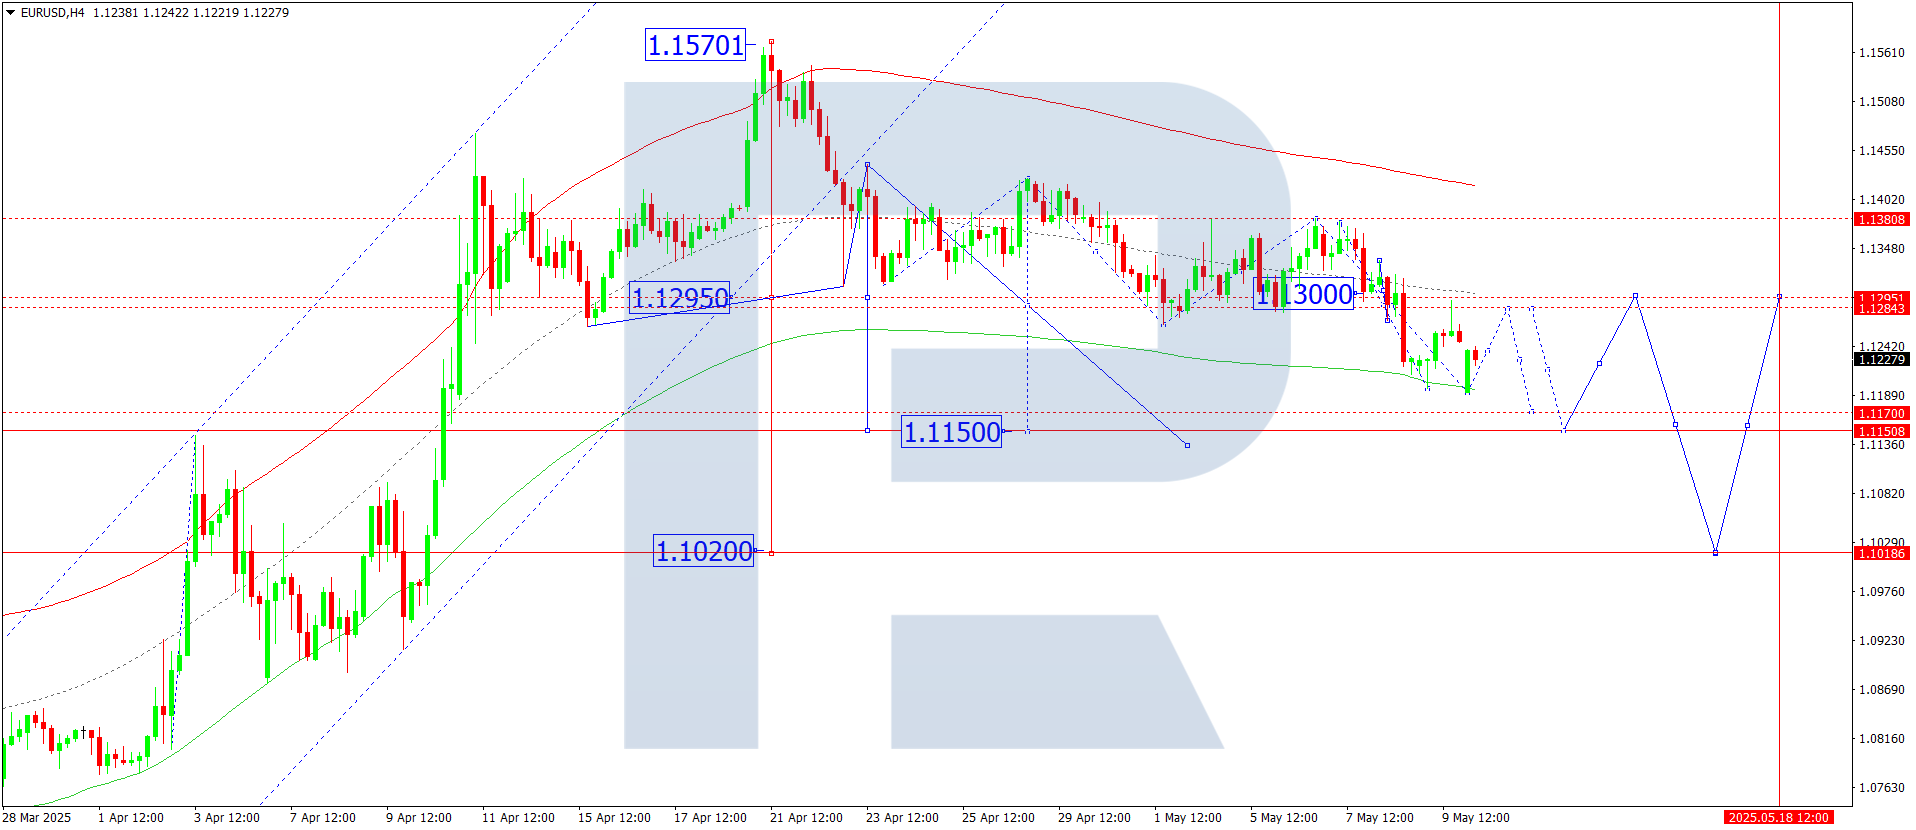
On the H4 chart, EURUSD broke below 1.1300 and continues its downward wave towards 1.1150, a local target. Today, 12 May 2025, the price reached 1.1192. A corrective move towards 1.1300 is possible during the day. Afterwards, a new downward wave may begin, targeting 1.1020.
This scenario is confirmed by the Elliott wave structure and the downward wave matrix with a pivot at 1.1300. This level remains key for EURUSD in the current wave. The market is now forming a downward wave towards the lower boundary of the price Envelope at 1.1150.
Technical indicators for today’s EURUSD forecast suggest a downward move to 1.1150.
USDJPY forecast
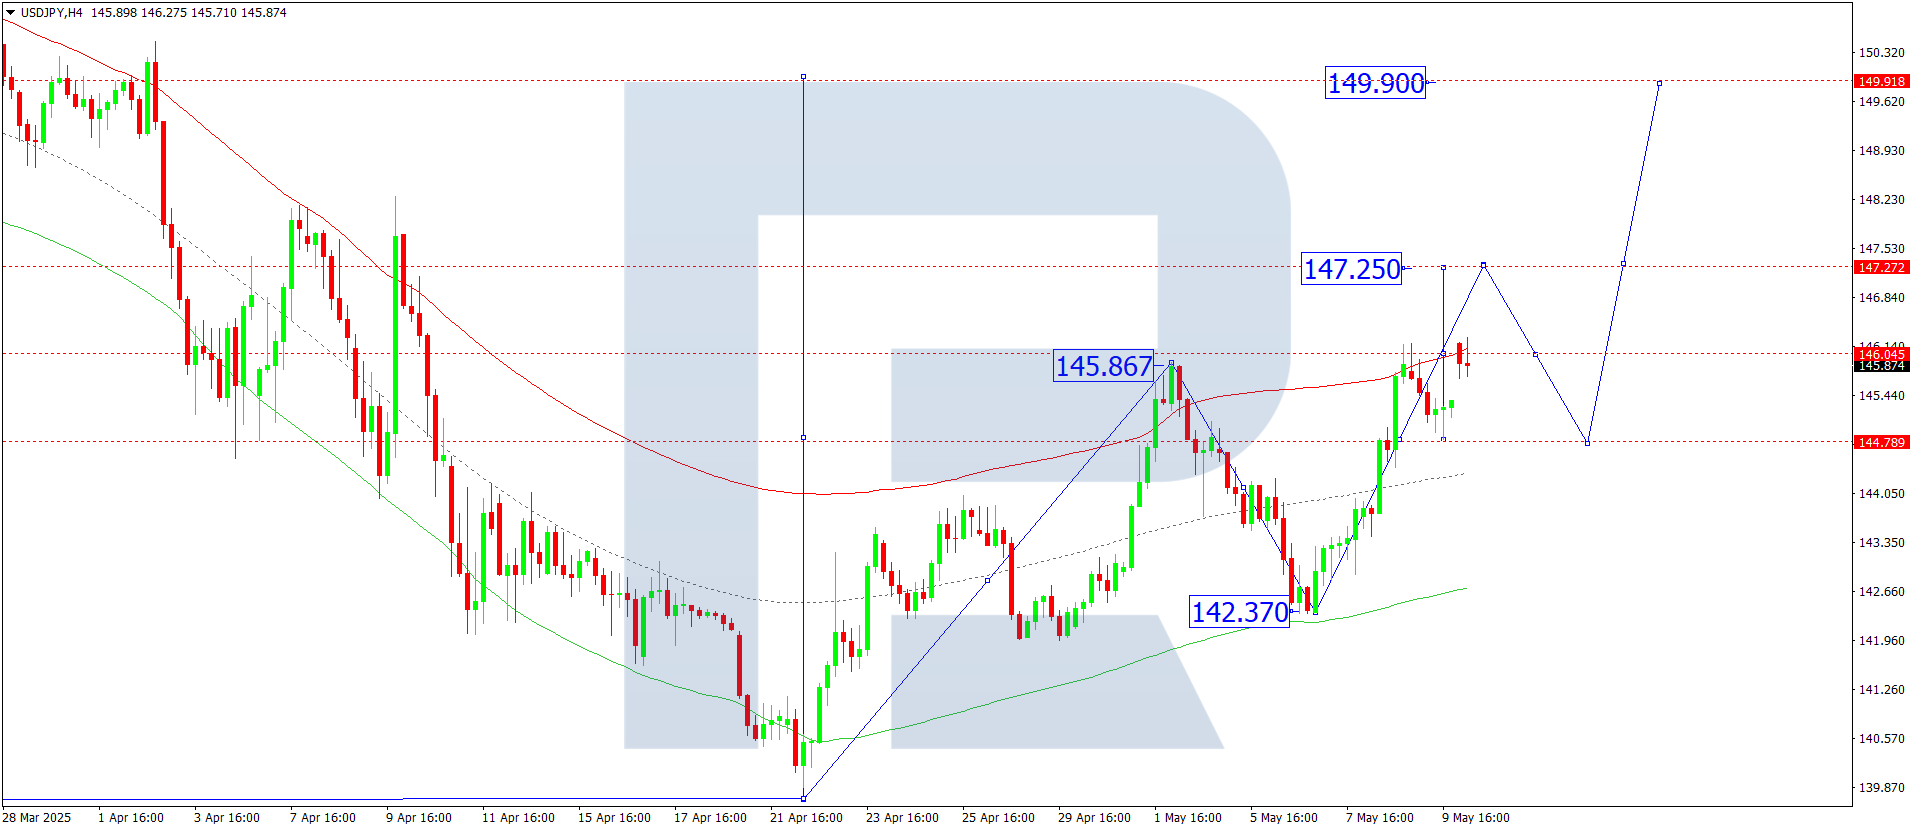
On the H4 chart, USDJPY found support at 144.82 and is continuing its growth towards 147.25 — the local target. Today, 12 May 2025, the price may reach this level. A correction to 144.82 (testing from above) is possible afterwards, followed by a new wave towards 149.90.
The scenario is technically supported by the Elliott wave structure and the growth wave matrix with a pivot at 144.82. The market is building the second half of the upward wave and is expected to complete a move to the upper boundary of the price Envelope at 147.25.
Technical indicators for today’s USDJPY forecast suggest a rise to 147.25.
GBPUSD forecast
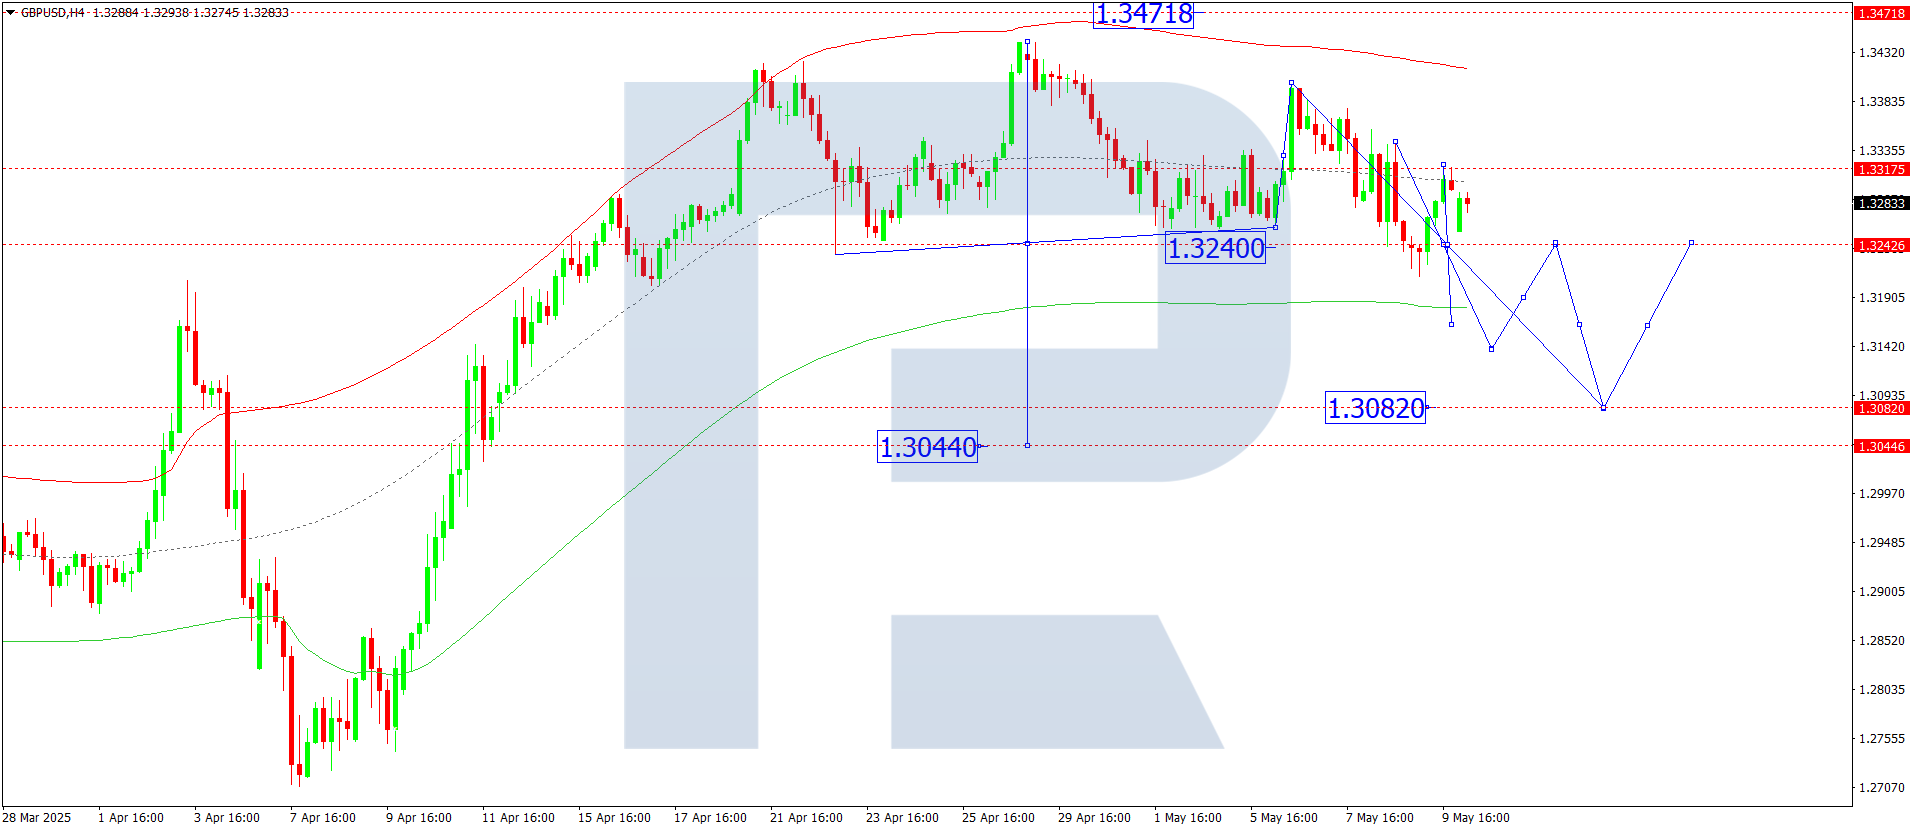
On the H4 chart, GBPUSD continues consolidating within a wide range around 1.3344. Today, 12 May 2025, the price extended the range downward to 1.3211 and bounced back to 1.3322. A new downward wave may follow towards 1.3082, the local target.
This scenario is supported by the Elliott wave structure and the downward wave matrix with a pivot at 1.3242. This level is considered crucial. The price is forming a wave towards the lower boundary of the price Envelope at 1.3082. A correction to the central line at 1.3242 may follow.
Technical indicators for today’s GBPUSD forecast suggest a decline to 1.3082.
AUDUSD forecast
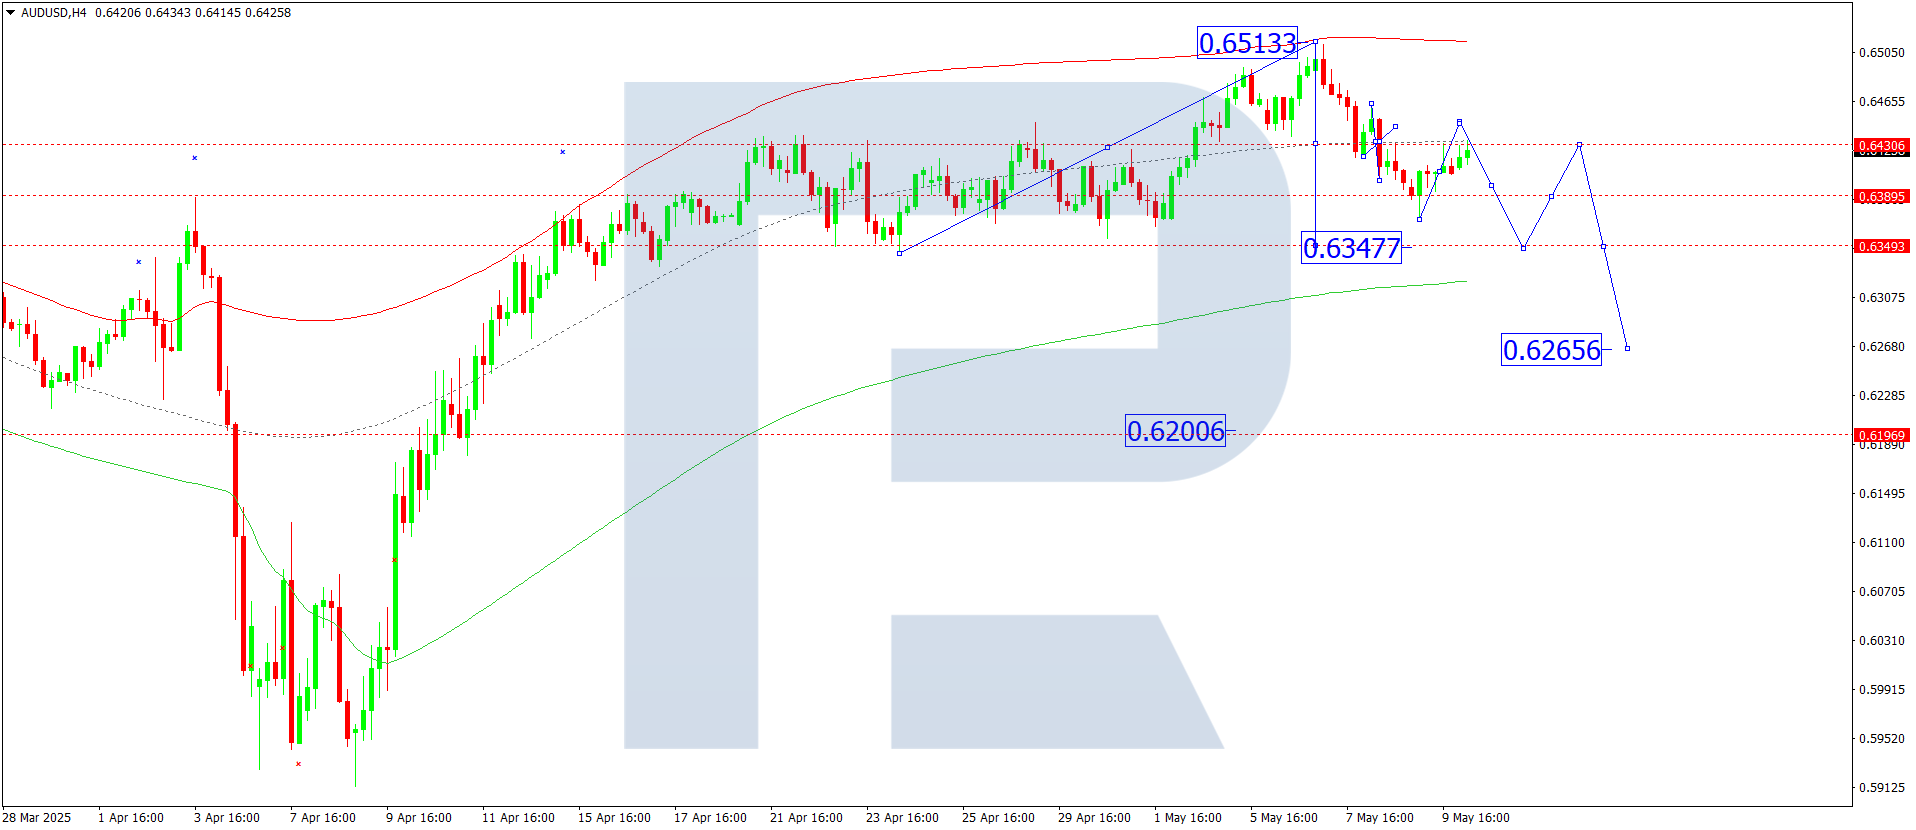
On the H4 chart, AUDUSD completed a downward wave to 0.6370. Today, 12 May 2025, a correction to 0.6444 is expected. Then, another wave of decline may begin, targeting 0.6347. If this level breaks, the price may continue falling to 0.6265, the local target.
This is confirmed by the Elliott wave structure and the downward wave matrix with a pivot at 0.6430, which is the key level for this wave. The market is now forming a wave to the lower boundary of the price Envelope at 0.6347, with a possible correction to its central line at 0.6430.
Technical indicators for today’s AUDUSD forecast suggest a decline to 0.6347.
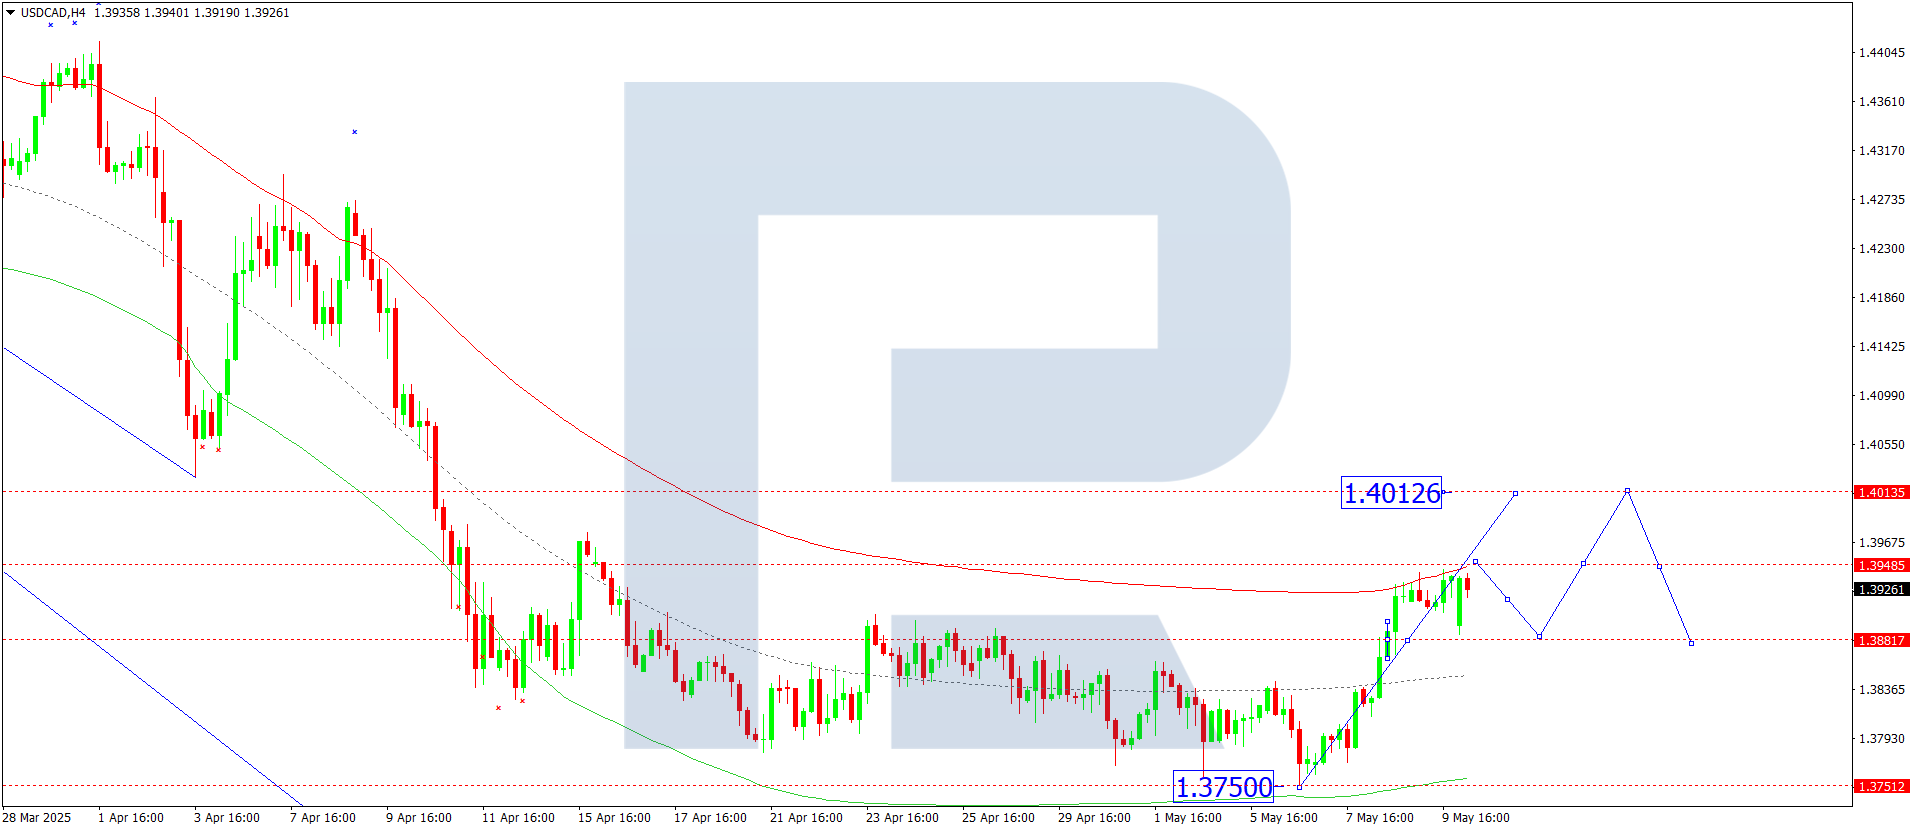
USDCAD forecast
On the H4 chart, USDCAD continues to develop a growth wave towards 1.3949. Today, 12 May 2025, this target may be reached, followed by a correction to 1.3880. Then, another upward wave towards 1.4012 may begin.
The Elliott wave structure and the growth wave matrix with a pivot at 1.3880 support this scenario. The price is currently approaching the upper boundary of the price Envelope at 1.3949. A correction to the central line at 1.3880 is likely.
Technical indicators for today’s USDCAD forecast suggest a rise to 1.4012.
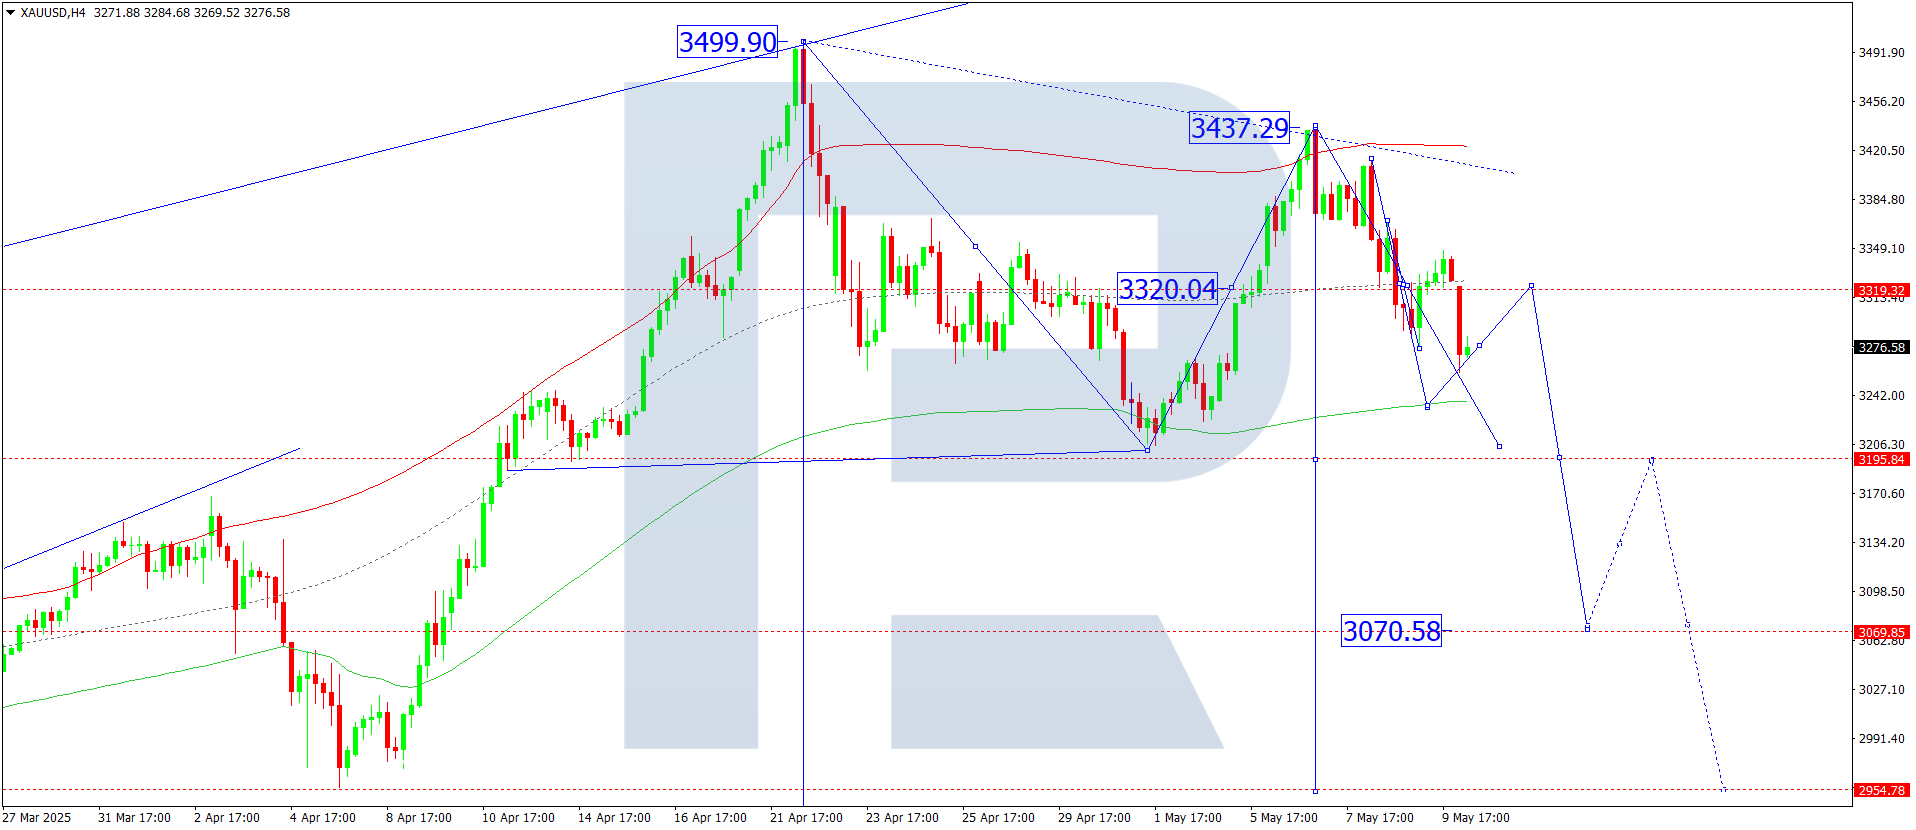
XAUUSD forecast
On the H4 chart, XAUUSD broke below 3,320 and is forming a downward wave towards 3,195. Today, 12 May 2025, this target may be reached, followed by a correction back to 3,320. Then, the price may continue falling to 3,070, a local target.
This outlook is supported by the Elliott wave structure and the downward wave matrix with a pivot at 3,320. This level is considered crucial for the current wave. The price is now moving towards the lower boundary of the price Envelope at 3,195, with a potential bounce to the central line at 3,320.
Technical indicators for today’s XAUUSD forecast suggest a decline to 3,195.
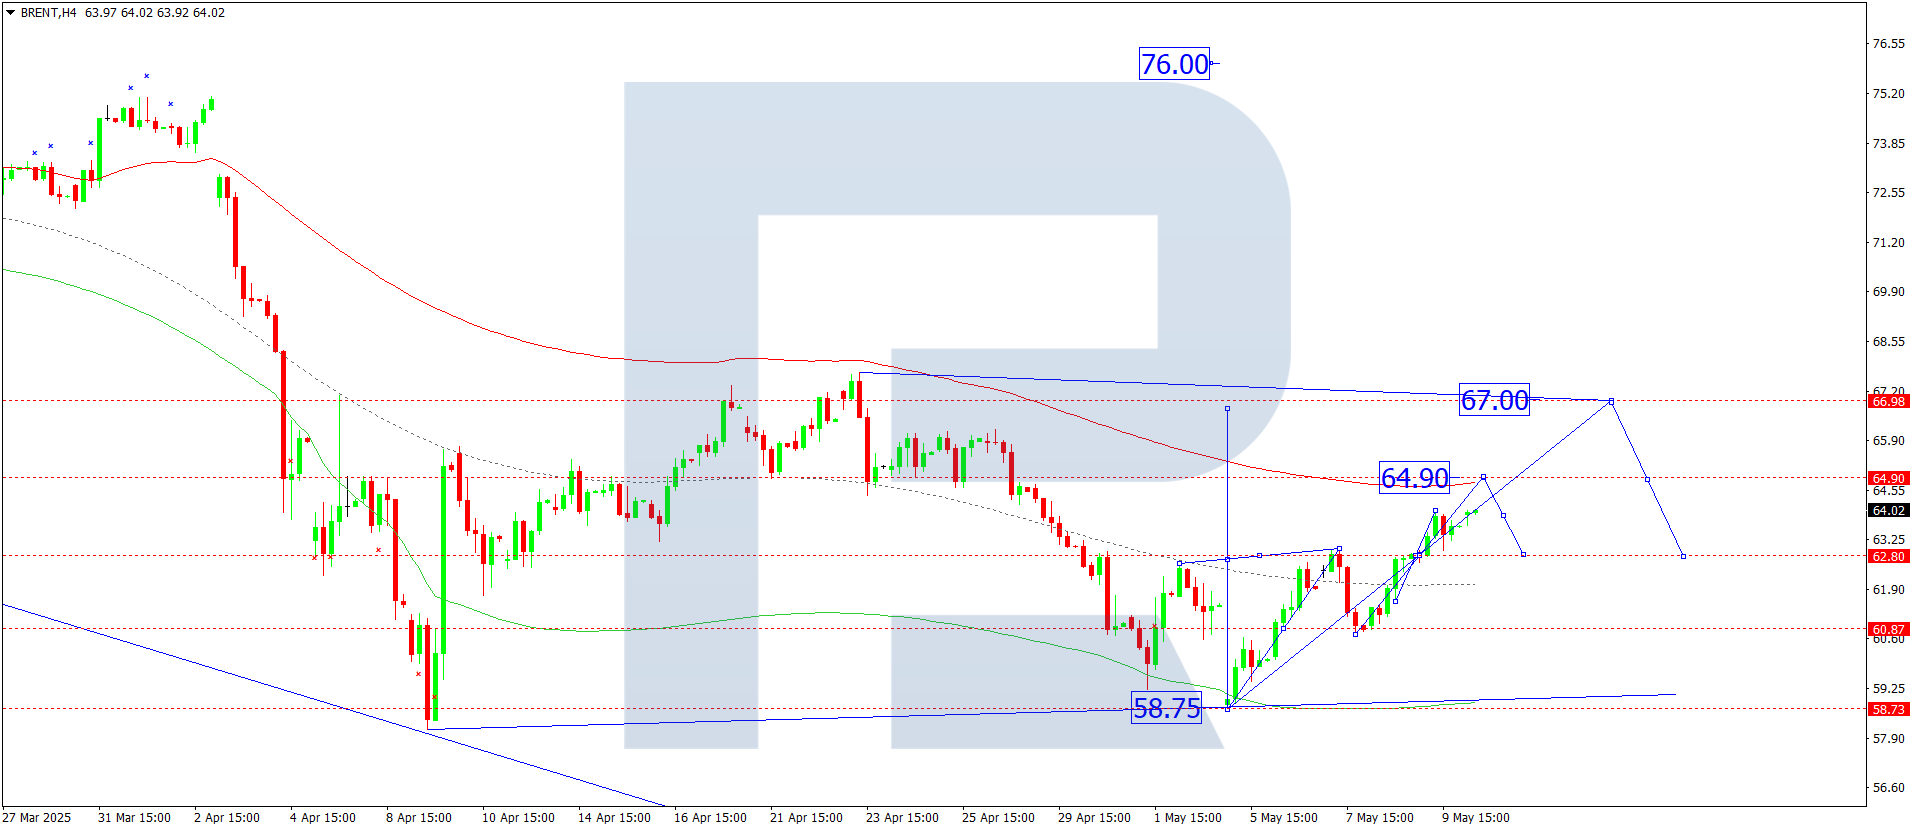
Brent forecast
On the H4 chart, Brent broke above 62.80 and continues its upward movement to 64.90. A wide consolidation range is forming around 62.80. Today, 12 May 2025, the price may continue its upward trajectory, aiming for 67.00 as the first target.
This scenario is supported by the Elliott wave structure and the downward wave matrix with a pivot at 62.80. The price is currently moving towards the upper boundary of the price Envelope at 64.90, after which a correction to the central line at 62.80 may follow.
Technical indicators for today’s Brent forecast suggest a continued rise to 64.90.
Forecasts presented in this section only reflect the author’s private opinion and should not be considered as guidance for trading. RoboForex bears no responsibility for trading results based on trading recommendations described in these analytical reviews.