EURUSD, USDJPY, GBPUSD, AUDUSD, USDCAD, XAUUSD, and Brent technical analysis and forecast for 6 May 2025
Here is a detailed daily technical analysis and forecast for EURUSD, USDJPY, GBPUSD, AUDUSD, USDCAD, XAUUSD, and Brent for 6 May 2025.
EURUSD forecast
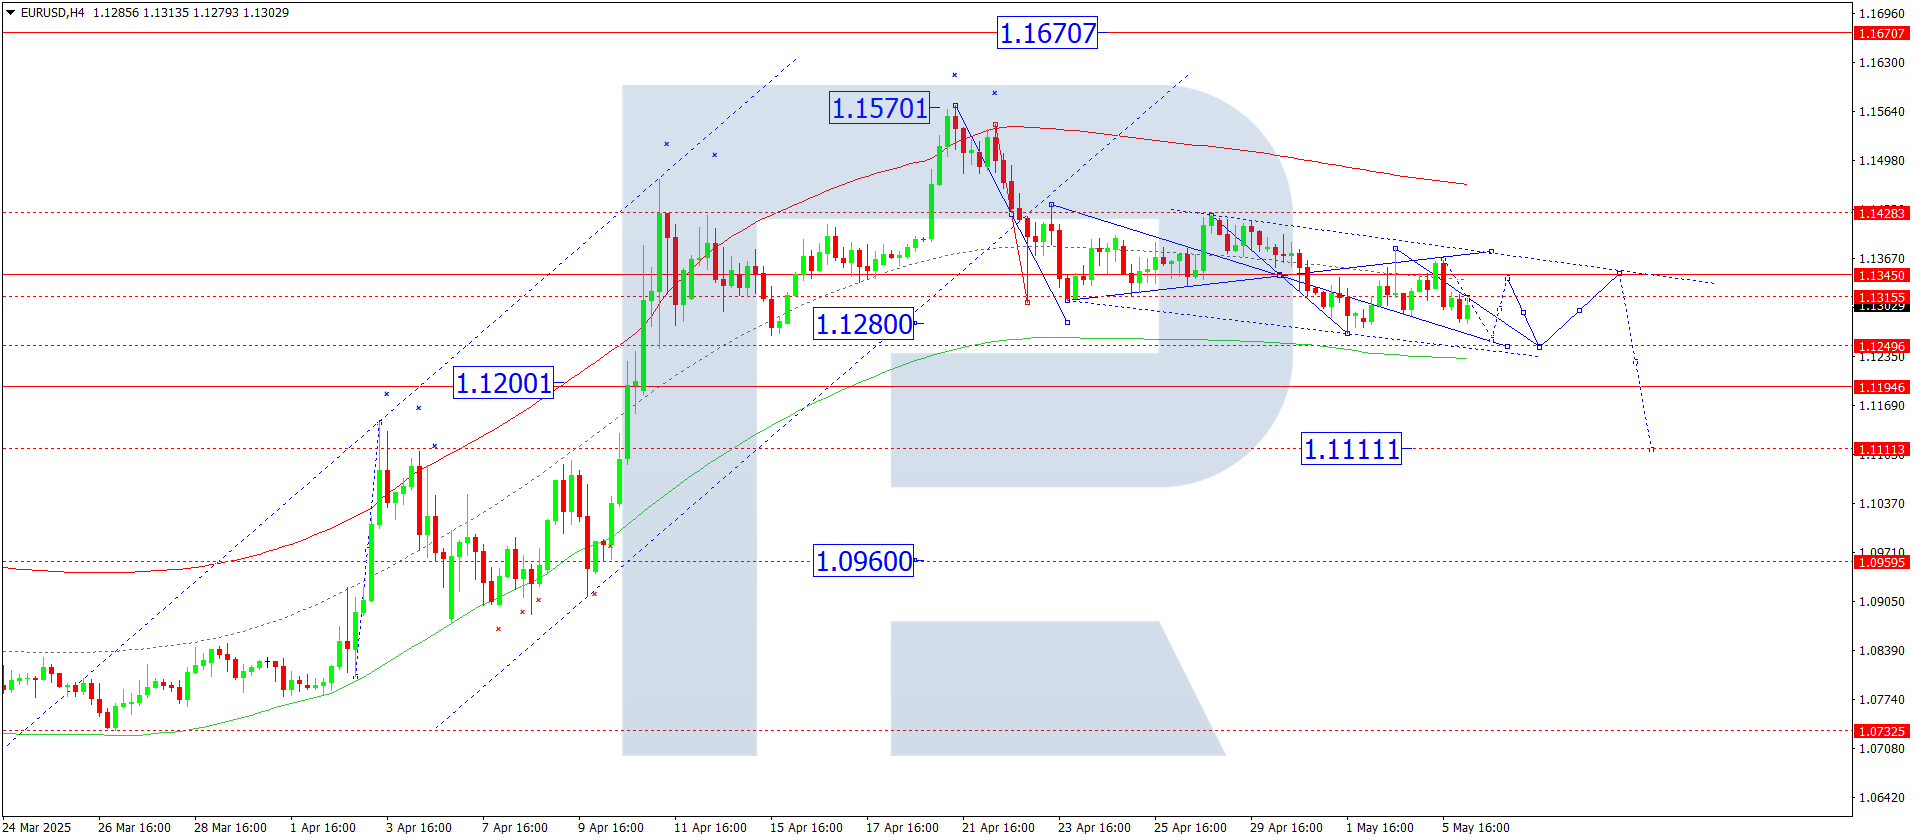
On the H4 chart, EURUSD continues consolidating around the 1.1345 level. On 6 May 2025, the market may extend the range downward to 1.1250 as a local target. A rebound to test 1.1345 from below is then expected, followed by a potential decline towards 1.1111.
This scenario is technically supported by the Elliott wave structure and the decline wave matrix with its pivot at 1.1345, which serves as a key level in this wave pattern. The current price action is shaping a move towards the lower boundary of the price Envelope at 1.1250.
Technical indicators for today’s EURUSD forecast suggest a continuation of the downward movement to 1.1250.
USDJPY forecast
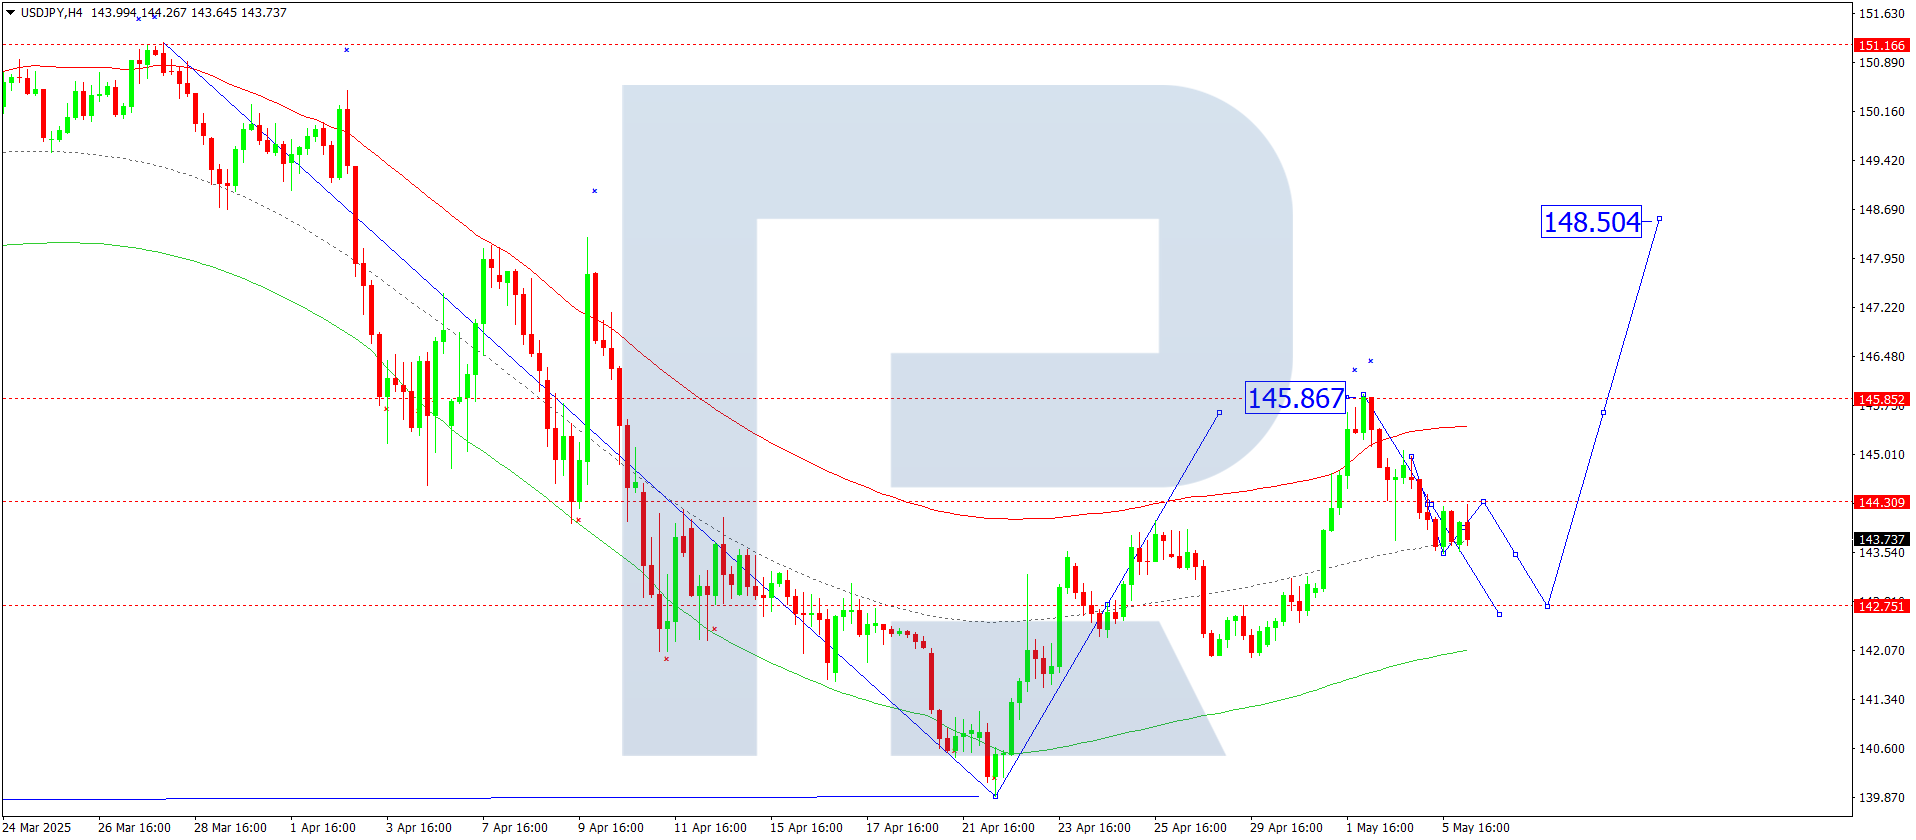
On the H4 chart, USDJPY is consolidating around 144.26. On 6 May 2025, the correction may continue towards 142.75. After that, a new wave of growth may begin, aiming for 145.85. If this level is broken, further growth could extend to 148.50 as a local target.
This scenario is confirmed by the Elliott wave structure and the growth wave matrix with a pivot at 142.75. This level remains a key point in the current pattern. The market has completed a growth wave, reaching the price Envelope’s upper boundary at 145.91. At the moment, the price is consolidating around its central line at 144.26, with expectations of a drop towards its lower boundary at 142.75.
Technical indicators for today’s USDJPY forecast support a corrective move down to 142.75.
GBPUSD forecast
On the H4 chart, GBPUSD continues forming a downward wave targeting 1.3247. On 6 May 2025, this level is expected to be reached, followed by a correction to 1.3344. Once this correction is completed, another leg down towards 1.3131 could develop as a local target.
The scenario is technically confirmed by the Elliott wave structure and the decline wave matrix with its pivot at 1.3344. This pivot remains key in the current structure. The price is consolidating around the central line of the price Envelope at 1.3344, with an expected move to the lower boundary at 1.3131. Afterwards, a correction towards 1.3247 is anticipated.
Technical indicators for today’s GBPUSD forecast suggest a downward structure towards 1.3131.

AUDUSD forecast
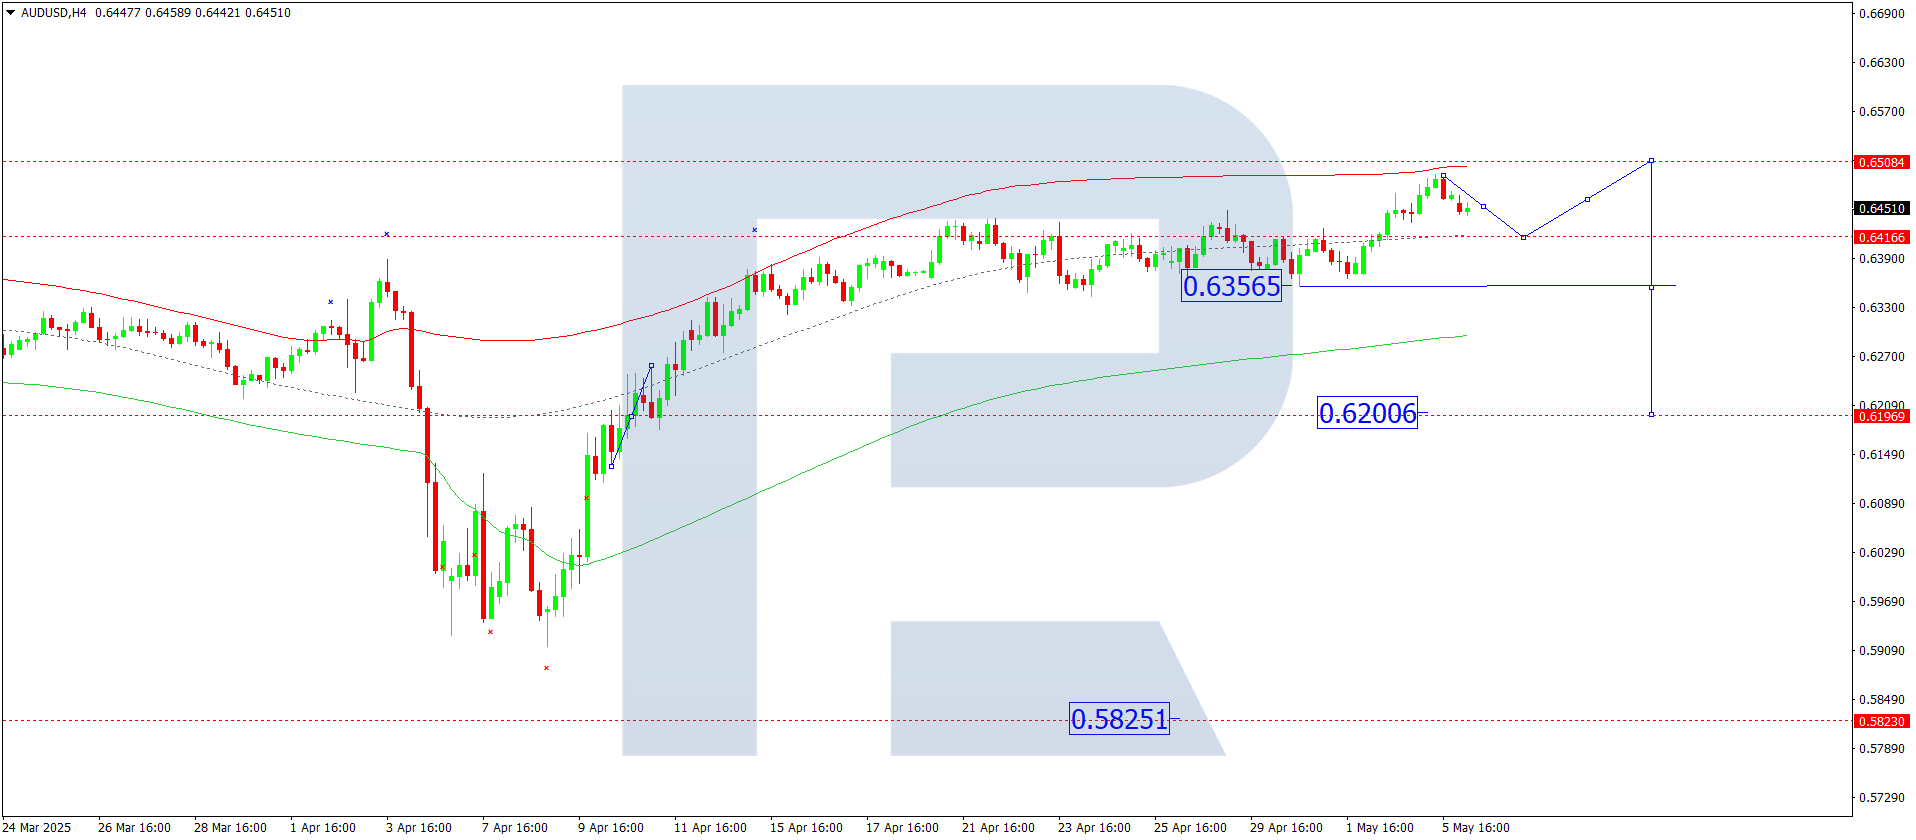
On the H4 chart, AUDUSD is forming a corrective wave towards 0.6416. On 6 May 2025, this correction may complete, giving way to a growth wave targeting 0.6508. Afterwards, a decline towards 0.6356 may occur. A breakout below this level could open the path to 0.6200 as a local target.
This scenario is technically backed by the Elliott wave structure and the growth wave matrix with a pivot at 0.6200, which is considered key within this pattern. The price is currently forming a wave towards the upper boundary of the price Envelope at 0.6508, with potential for a decline to the central line at 0.6356.
Technical indicators for today’s AUDUSD forecast point to a likely start of a downward wave to 0.6356.
USDCAD forecast
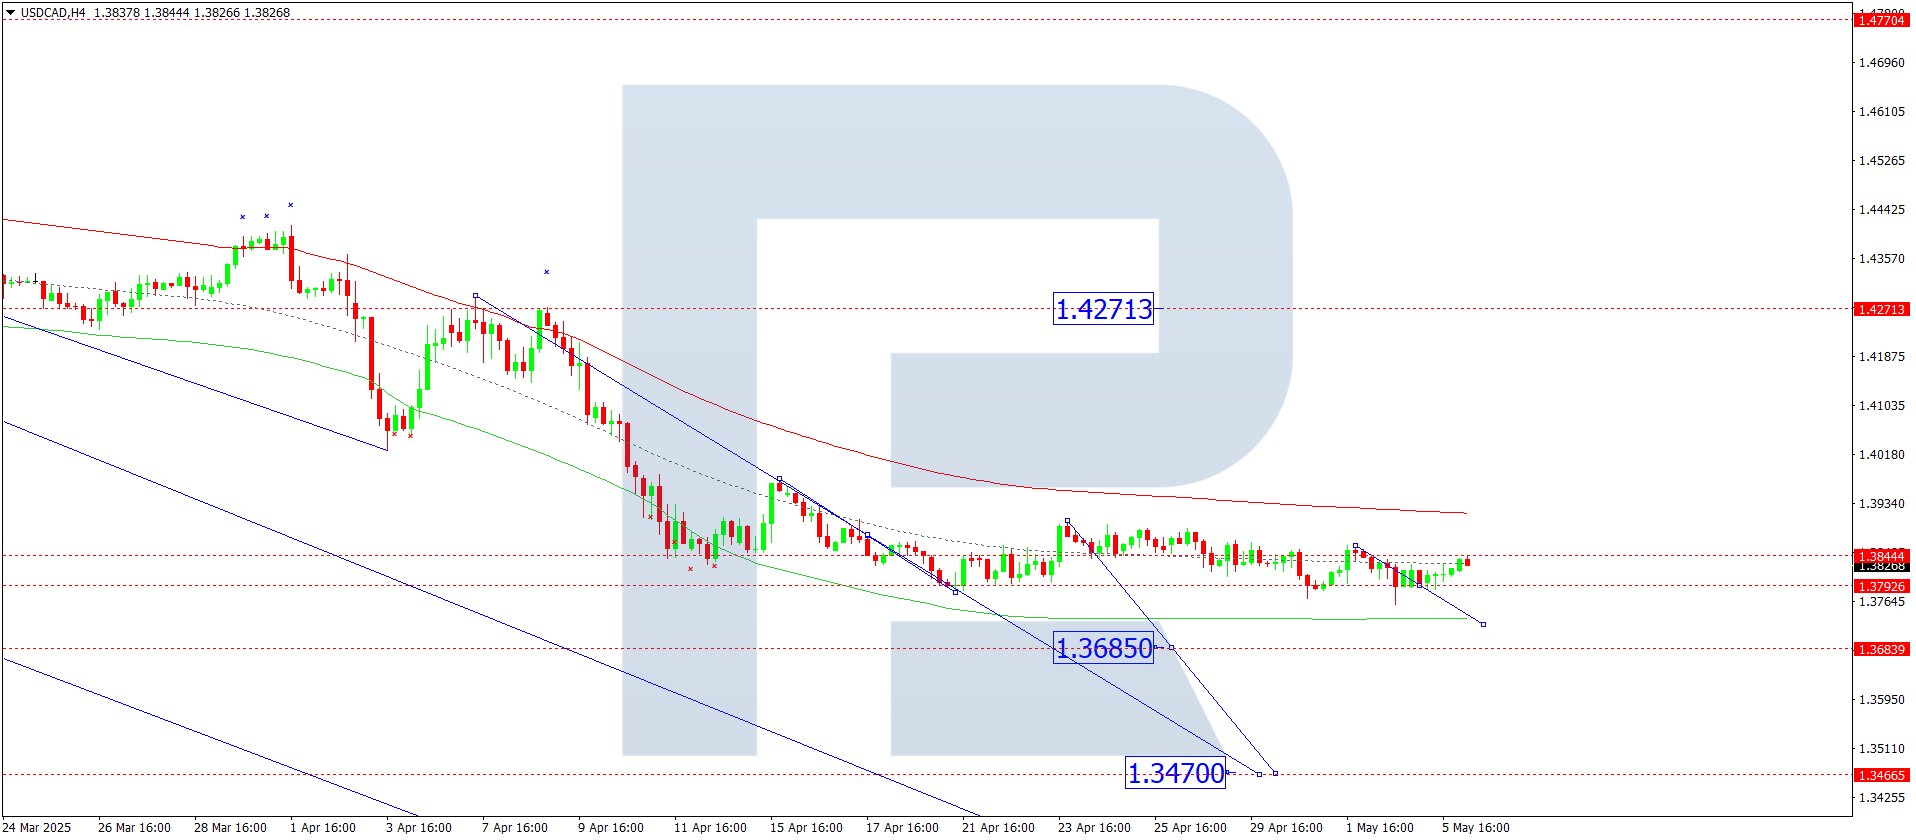
On the H4 chart, USDCAD is forming a wave leg towards 1.3725. On 6 May 2025, this level may be reached, followed by a correction to 1.3790. Afterwards, another downward wave may unfold towards 1.3470.
The outlook is confirmed by the Elliott wave structure and the decline wave matrix with a pivot at 1.3844, acting as a key level for USDCAD. Currently, the price is moving towards the lower boundary of the price Envelope at 1.3685, followed by a potential correction to the centre at 1.3790.
Technical indicators for today’s USDCAD forecast suggest a downward wave to 1.3685.
XAUUSD forecast
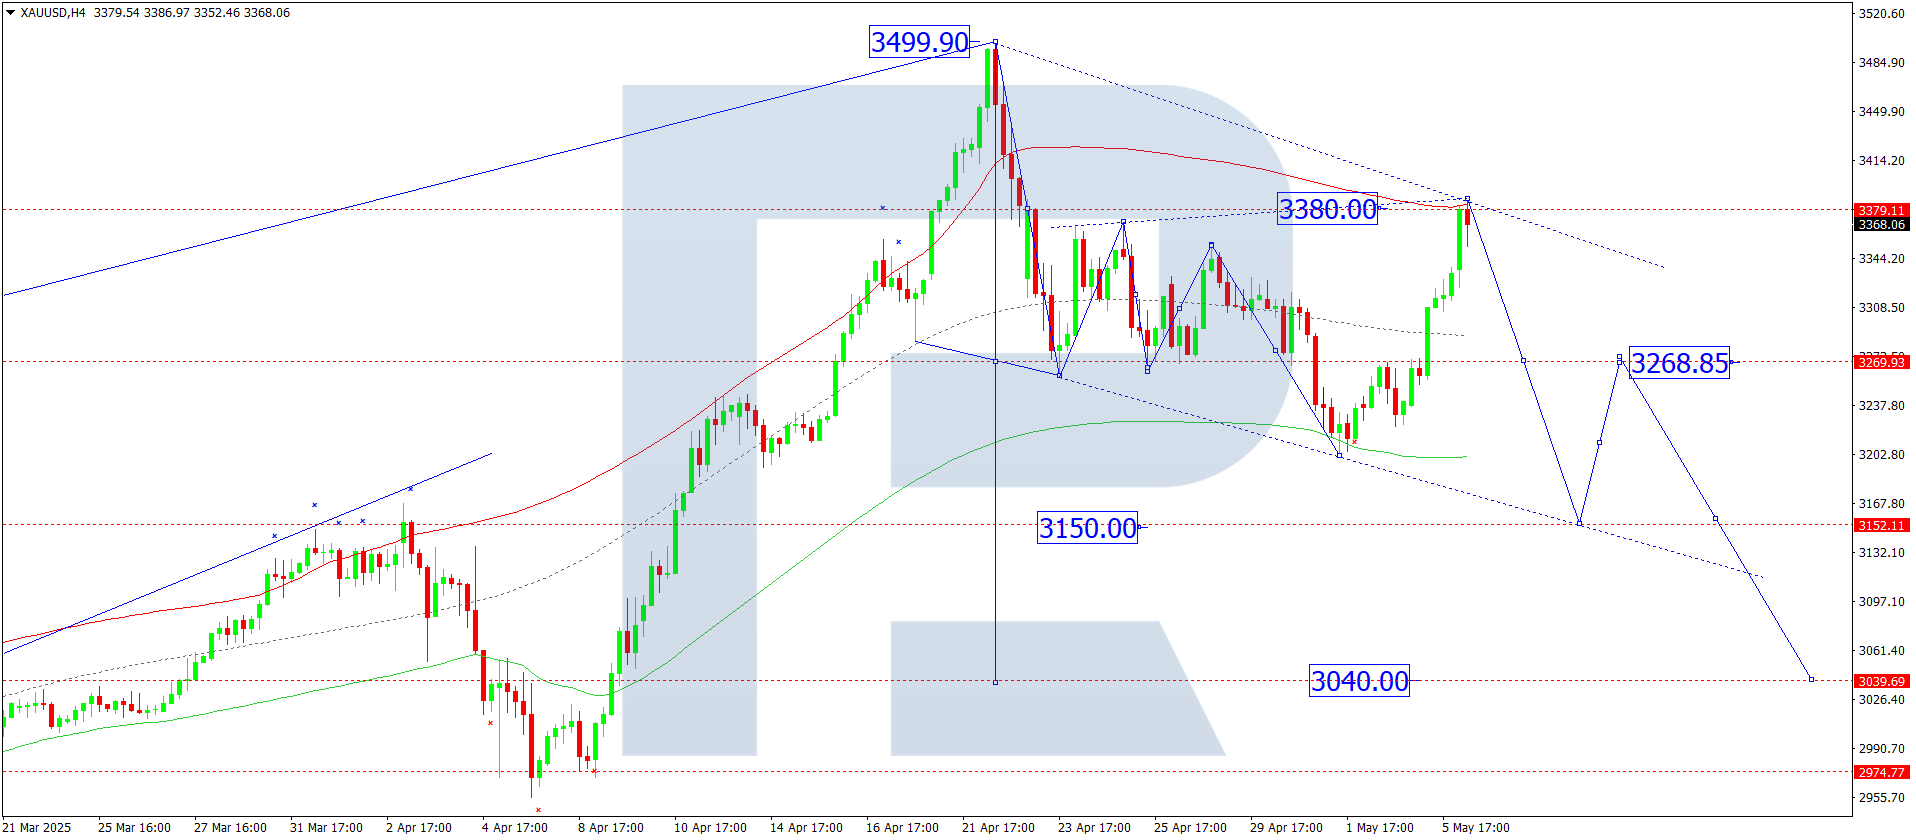
On the H4 chart, XAUUSD completed a correction wave to 3,380. On 6 May 2025, a decline to 3,268 may begin. A breakout below this level could extend the wave to 3,150 as a local target.
This scenario is technically supported by the Elliott wave structure and the decline wave matrix with its pivot at 3,268, which is key in this pattern. The current price action forms a move towards the lower boundary of the price Envelope at 3,150. After hitting this target, a rebound to the central line at 3,268 is expected.
Technical indicators for today’s XAUUSD forecast point to a possible decline to 3,150.
Brent forecast
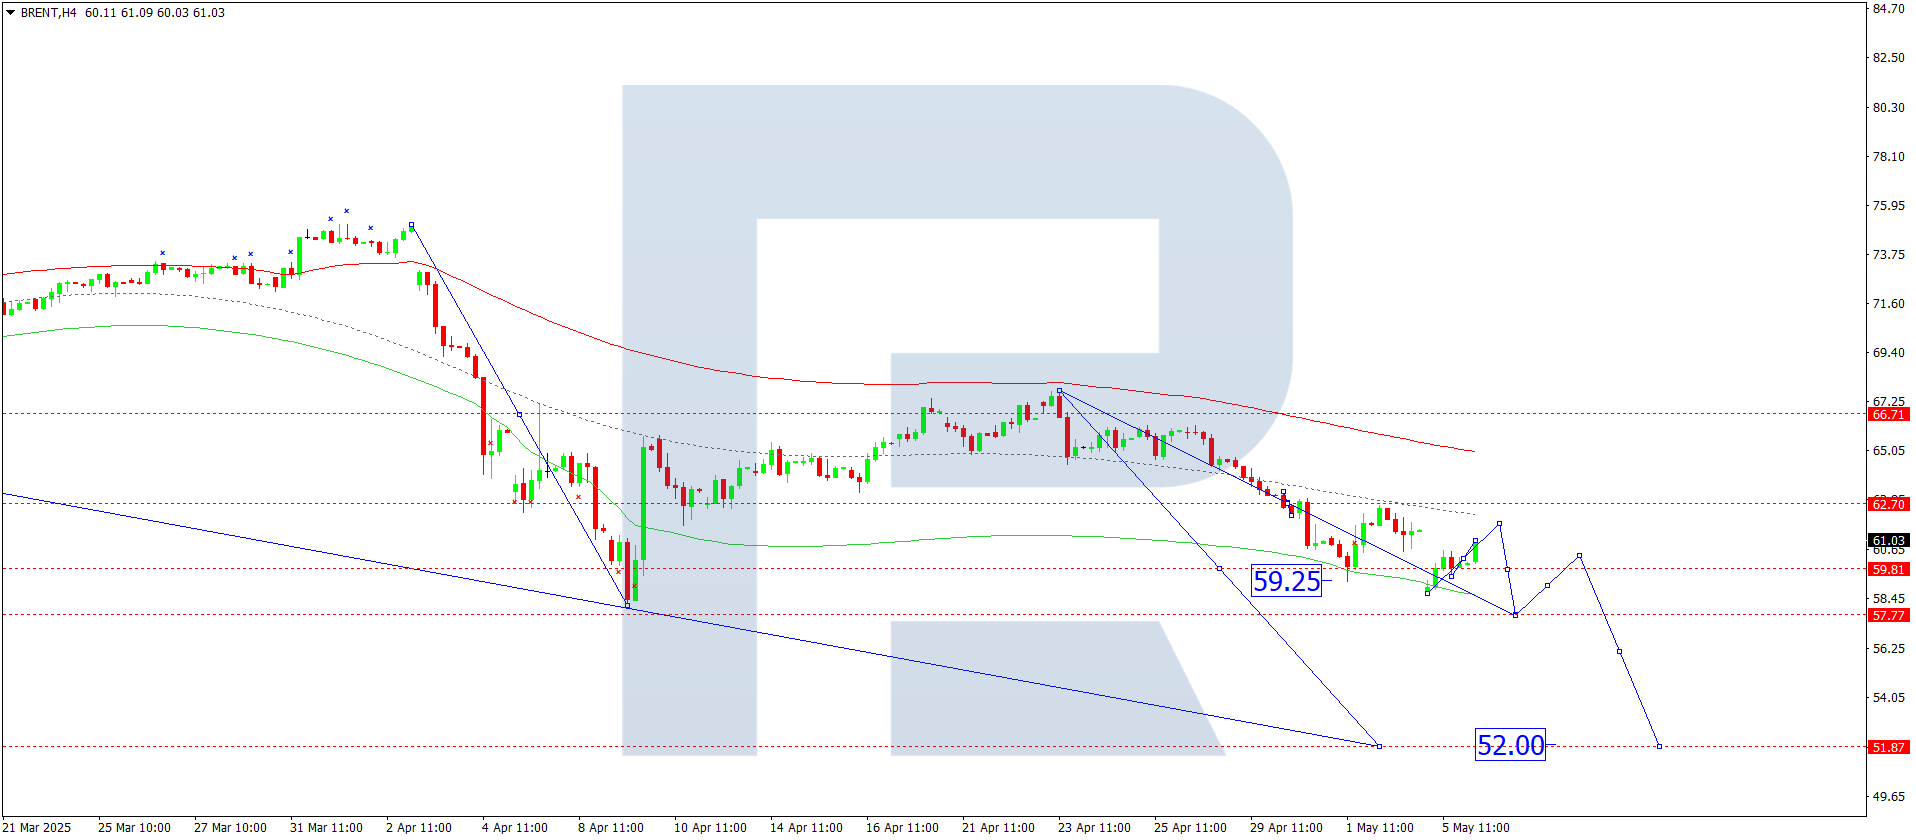
On the H4 chart, Brent crude is consolidating around 62.70. The current range has extended down to 58.70. On 6 May 2025, a technical pullback to 61.80 (testing from below) is possible. Afterwards, a new downward wave could begin targeting 57.77 as a local target.
This outlook is supported by the Elliott wave structure and the decline wave matrix with its pivot at 62.70, considered key for Brent in this wave. The market is forming a move towards the lower boundary of the price Envelope at 57.77. Once this level is reached, a rebound towards the centre at 62.70 is expected.
Technical indicators for today’s Brent forecast support a continuation of the downward move to 57.77.
Forecasts presented in this section only reflect the author’s private opinion and should not be considered as guidance for trading. RoboForex bears no responsibility for trading results based on trading recommendations described in these analytical reviews.