EURUSD, USDJPY, GBPUSD, AUDUSD, USDCAD, XAUUSD, and Brent technical analysis and forecast for 5 May 2025
Here is a detailed daily technical analysis and forecast for EURUSD, USDJPY, GBPUSD, AUDUSD, USDCAD, XAUUSD, and Brent for 5 May 2025.
EURUSD forecast
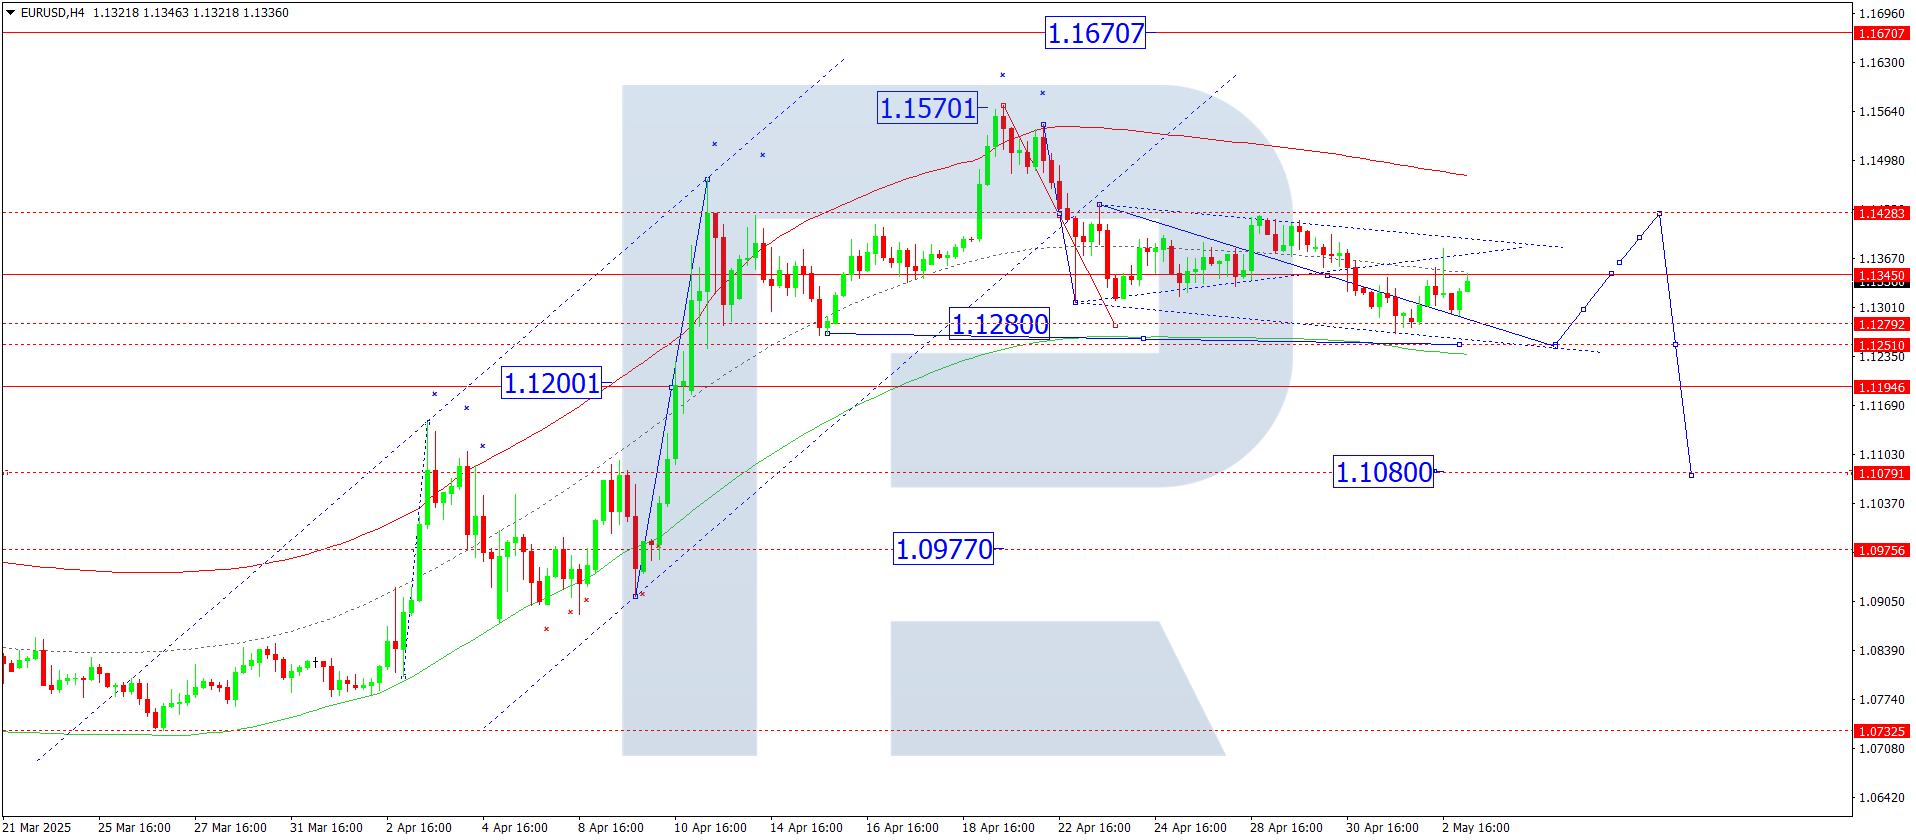
On the H4 chart, EURUSD completed a downward wave to 1.1266, followed by a correction to 1.1380. As of 5 May 2025, the market is forming a consolidation range below 1.1345. It is currently balanced, with potential for the range to extend down to 1.1250 or up to 1.1420. A breakout to the downside could lead to further decline towards 1.1080 as a local target. If the breakout occurs upwards, another growth leg may reach 1.1670. After that, the next downward wave might aim for 1.0733.
This scenario is technically supported by the Elliott wave structure and a decline wave matrix with a pivot at 1.1420, which serves as the key level. At the moment, the price is forming a downward structure towards the lower boundary of the price Envelope at 1.1250.
Technical indicators for today’s EURUSD forecast suggest a downward wave to 1.1250.
USDJPY forecast
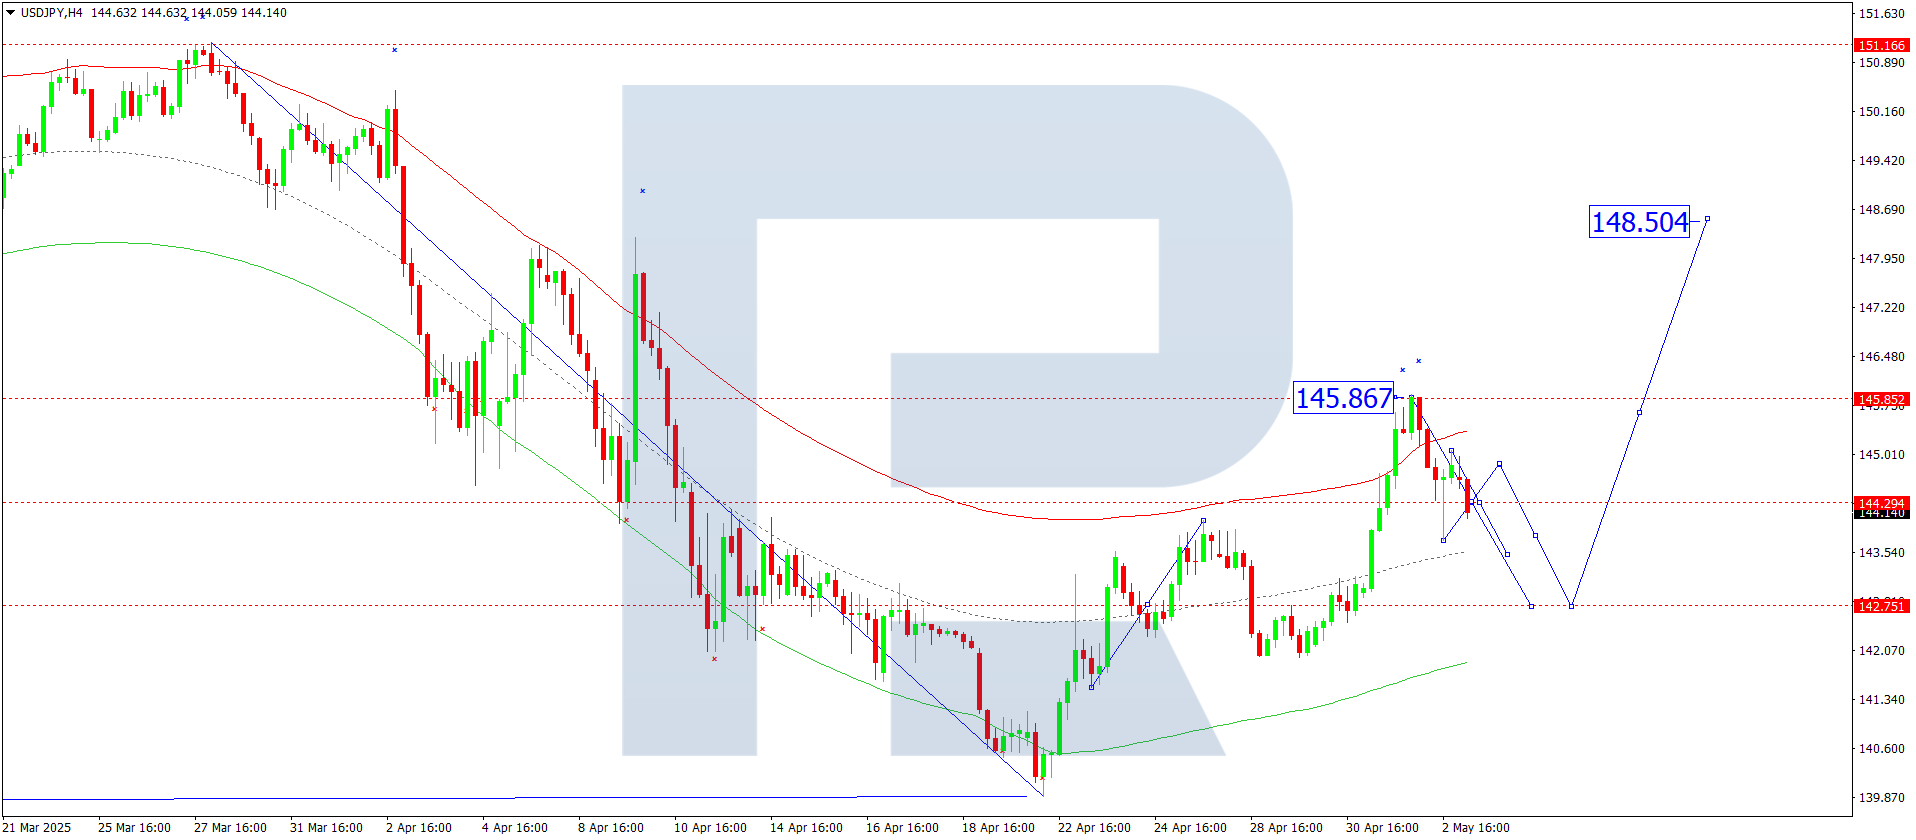
On the H4 chart, USDJPY completed an upward wave to 145.91 and corrected to 143.73. On 5 May 2025, there is potential for the correction to continue to 143.50, possibly extending further to 142.75. After that, a new growth wave might begin towards 148.50.
This scenario is confirmed by the Elliott wave structure and the upward wave matrix with a pivot at 142.75, which is key to this pattern. The current wave reached the upper boundary of the price Envelope at 145.91. A correction towards the lower boundary at 142.75 remains possible.
Technical indicators for today’s USDJPY forecast suggest a correction towards 143.50 and 142.75.
GBPUSD forecast
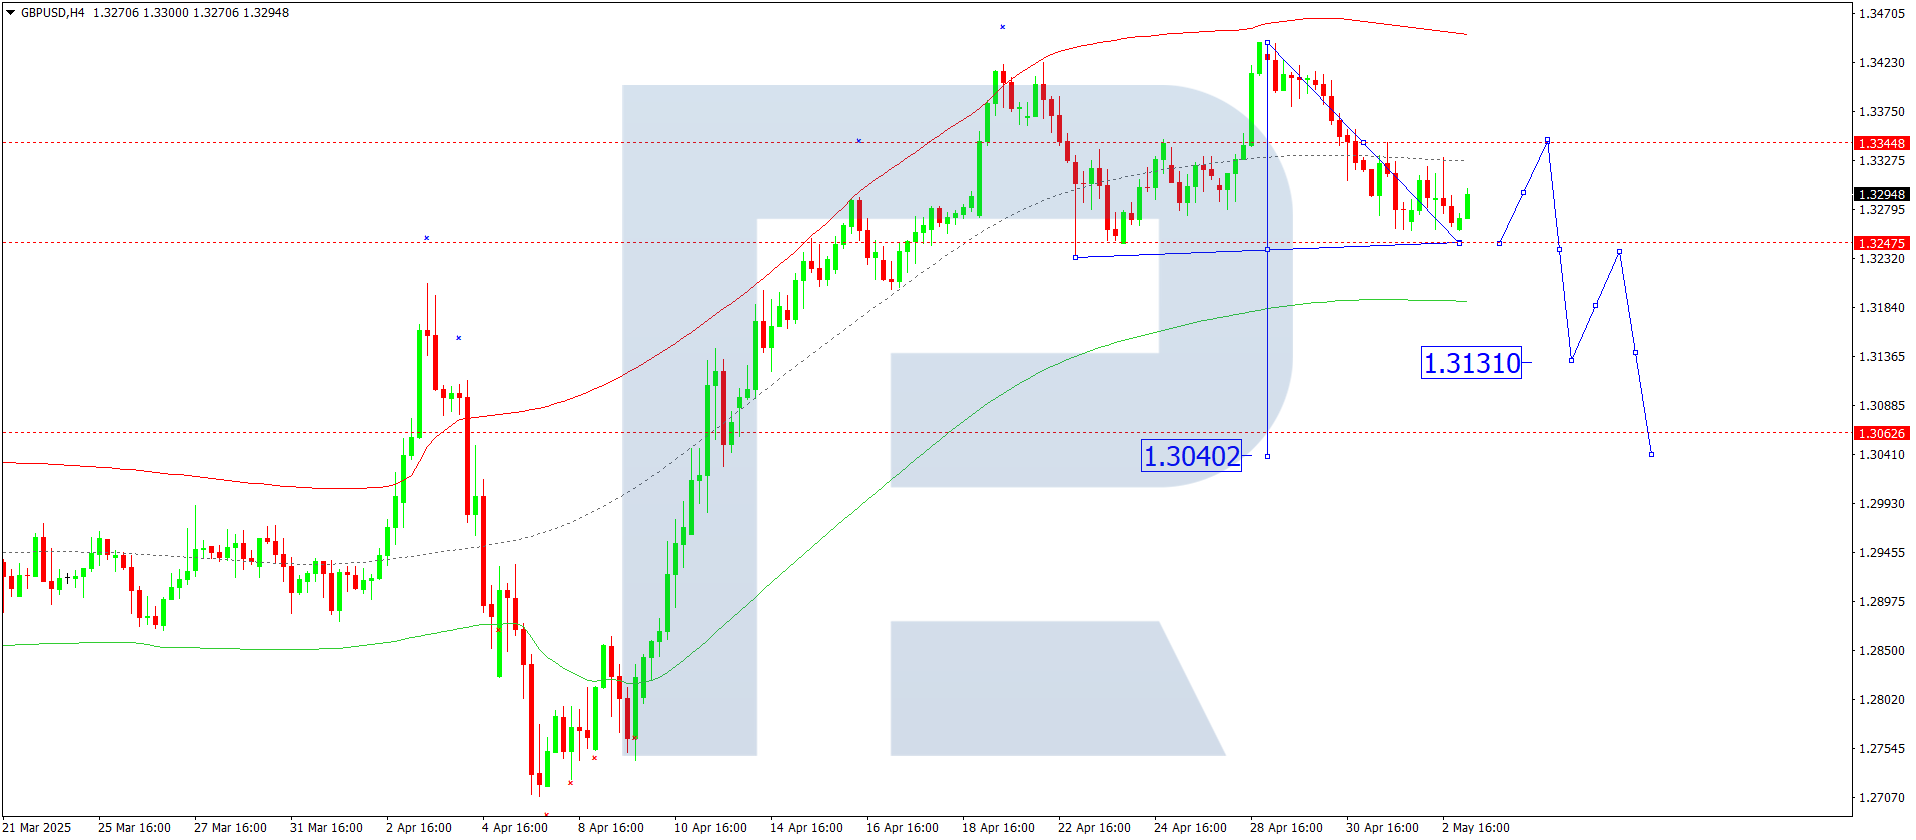
On the H4 chart, GBPUSD completed a downward wave to 1.3260 and a correction to 1.3330. On 5 May 2025, a brief rise to 1.3344 is possible, followed by a decline to 1.3247. The market may form a consolidation range around 1.3344. A downward breakout could extend the decline to 1.3131 as a local target. An upward breakout might send the price to 1.3470, after which a drop to 1.2700 is expected.
The scenario is technically confirmed by the Elliott wave structure and a decline wave matrix with a pivot at 1.3344. This pivot serves as the key level. Currently, the price is consolidating near the central line of the price Envelope at 1.3344, with possible movement towards its upper boundary at 1.3455, followed by a decline to the lower boundary at 1.3131. A subsequent correction to the centre at 1.3245 is likely.
Technical indicators for today’s GBPUSD forecast suggest a decline to 1.3131.
AUDUSD forecast
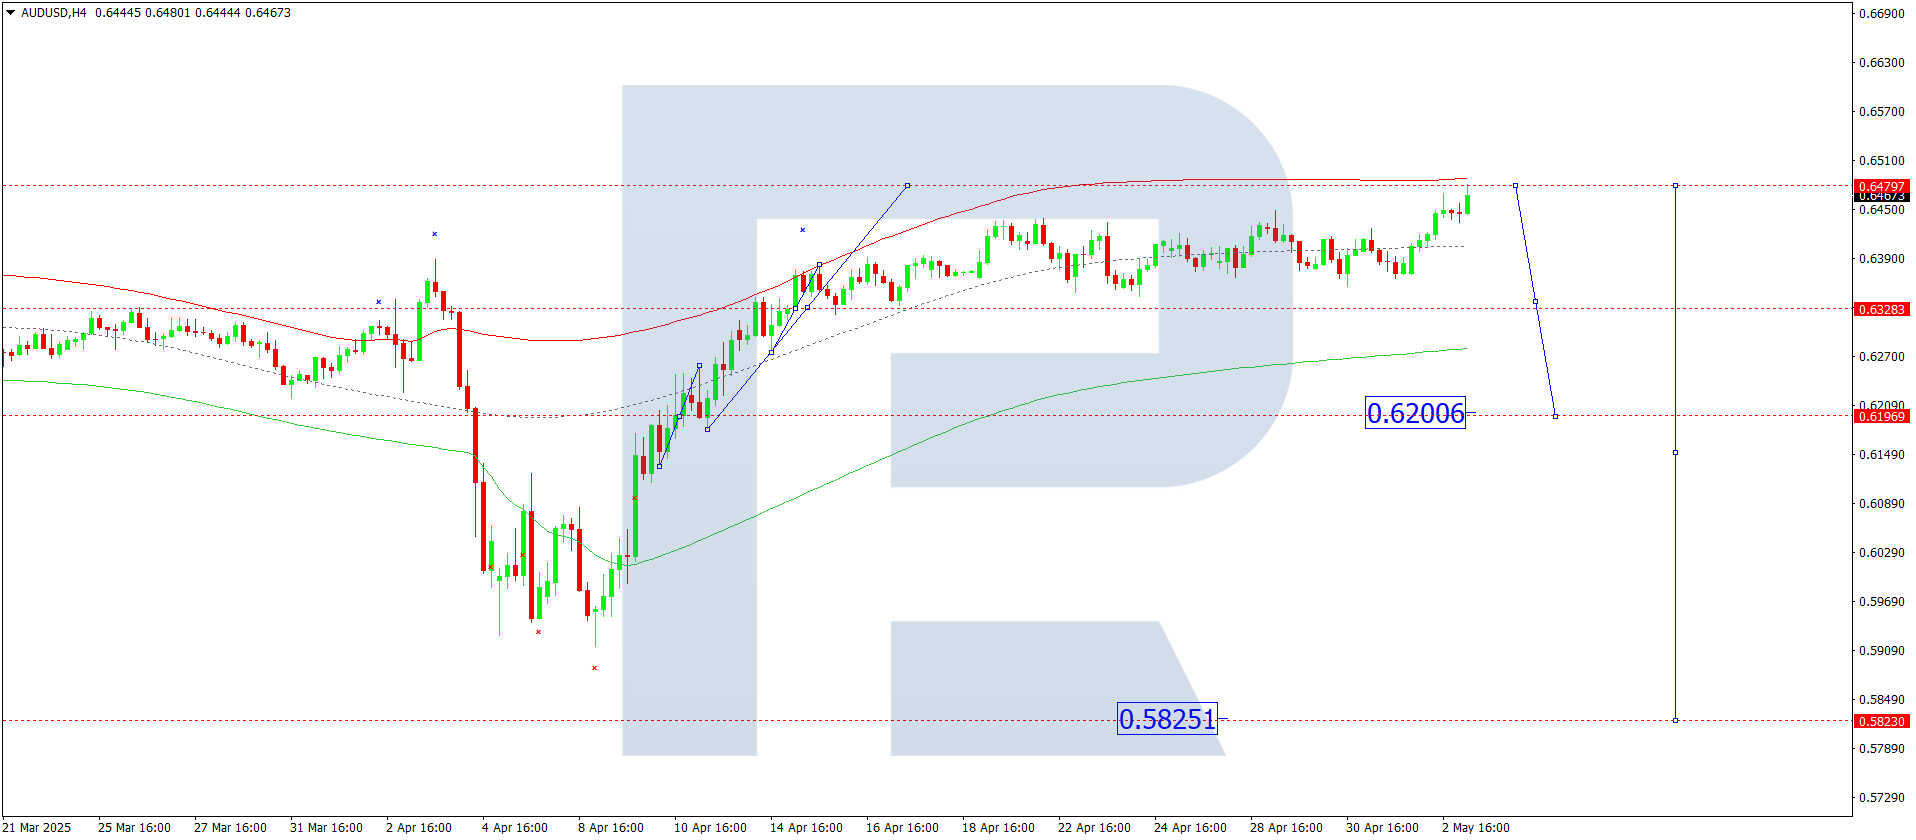
On the H4 chart, AUDUSD continues to form a consolidation range around 0.6328. On 5 May 2025, the range may extend to the upside towards 0.6500. Afterwards, a downward breakout to 0.6200 may follow as the first target. The price could correct towards 0.6330 (testing from below) before declining to 0.6100 as a local target.
This outlook is confirmed by the Elliott wave structure and a growth wave matrix with a pivot at 0.6200. This pivot is key to the current pattern. The structure is progressing towards the upper boundary of the price Envelope at 0.6500, with potential for a drop to the central line at 0.6330.
Technical indicators for today’s AUDUSD forecast suggest the likelihood of a downward wave towards 0.6200.
USDCAD forecast
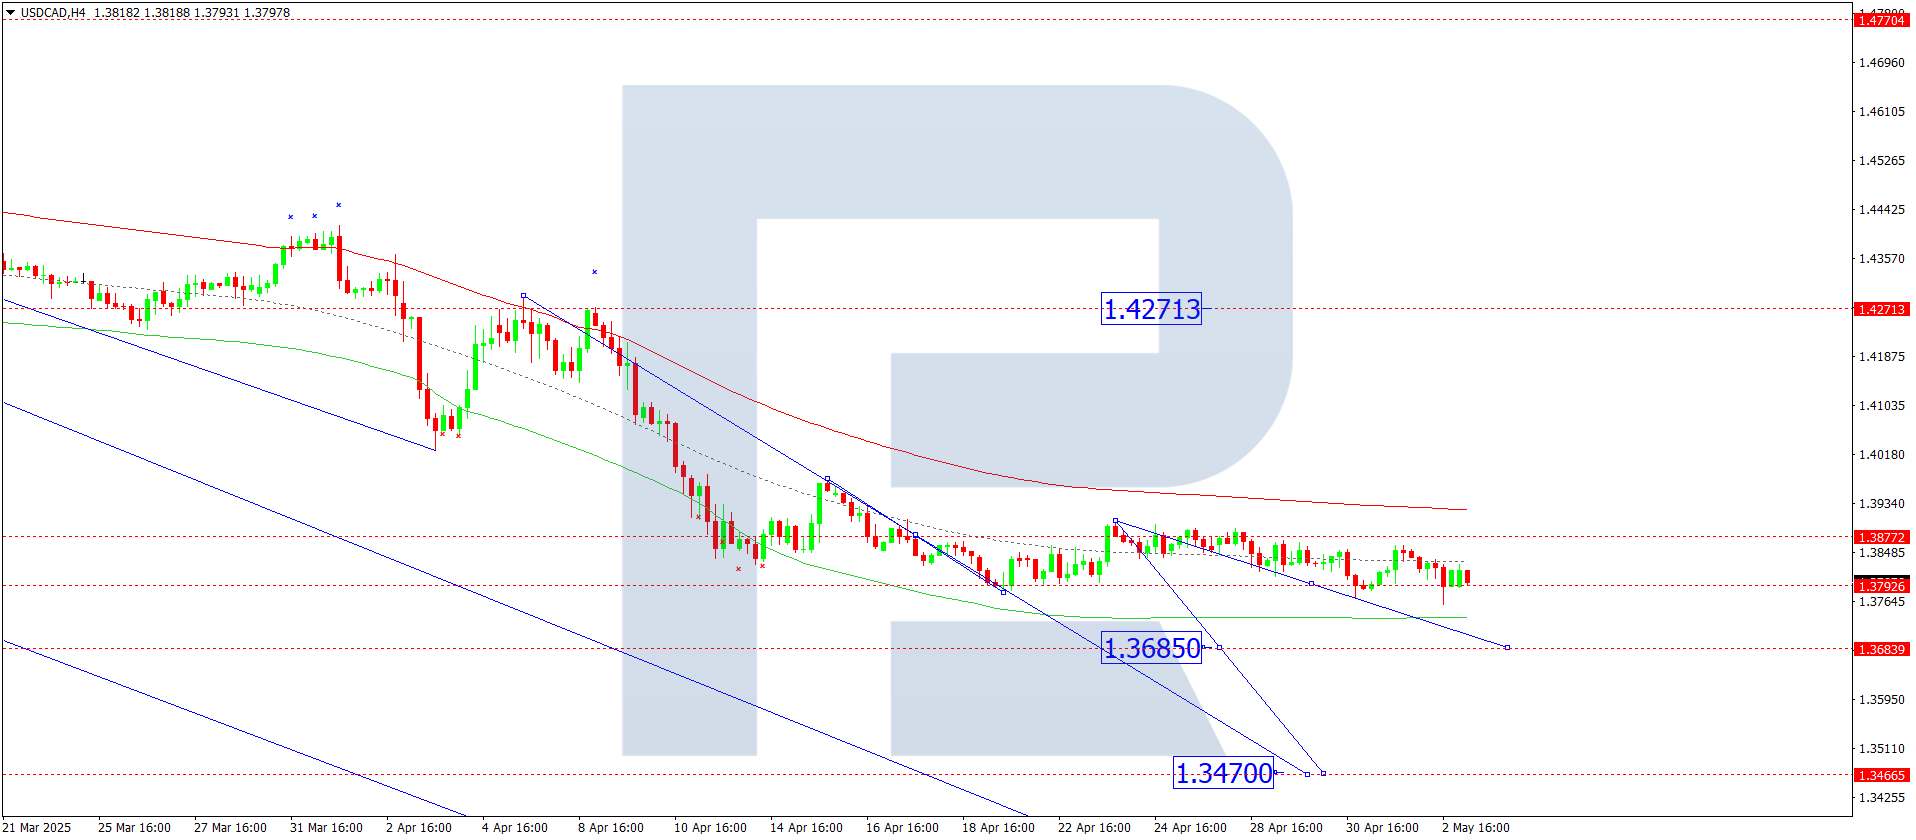
On the H4 chart, USDCAD is forming a wave leg towards 1.3684. On 5 May 2025, the market is expected to reach this target and then correct upwards to 1.3790. A subsequent downward wave might extend to 1.3470.
This scenario is technically supported by the Elliott wave structure and a downward wave matrix with a pivot at 1.3877. This pivot is considered key in the current structure. The price is forming a downward wave towards the lower boundary of the price Envelope at 1.3684. A correction towards the central line at 1.3790 is anticipated afterwards.
Technical indicators for today’s USDCAD forecast suggest a downward wave towards 1.3684.
XAUUSD forecast
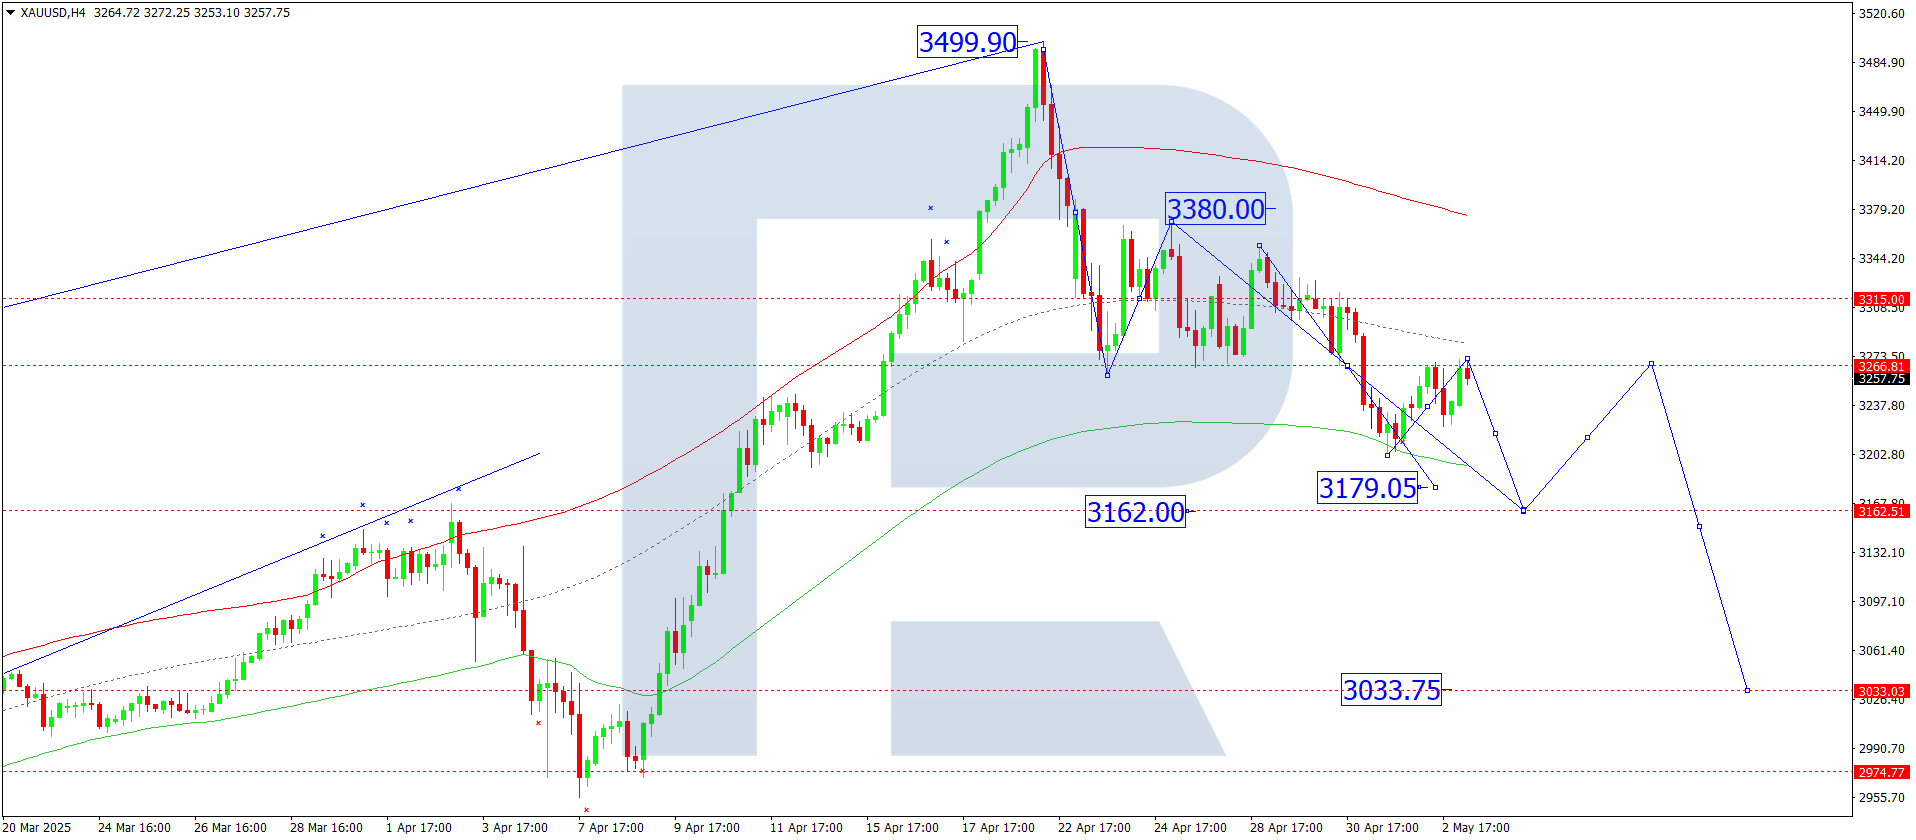
On the H4 chart, XAUUSD completed a downward wave to 3,202 and a correction to 3,266. On 5 May 2025, another drop to 3,165 may occur. A correction to 3,266 is likely to follow. Once the correction completes, a new downward wave could reach 3,033.
The scenario is supported by the Elliott wave structure and a decline wave matrix with a pivot at 3,266, which is key to the current pattern. The price is heading towards the lower boundary of the price Envelope at 3,165. After reaching this level, a rebound towards the centre at 3,266 is expected.
Technical indicators for today’s XAUUSD forecast suggest a decline to 3,165.
Brent forecast
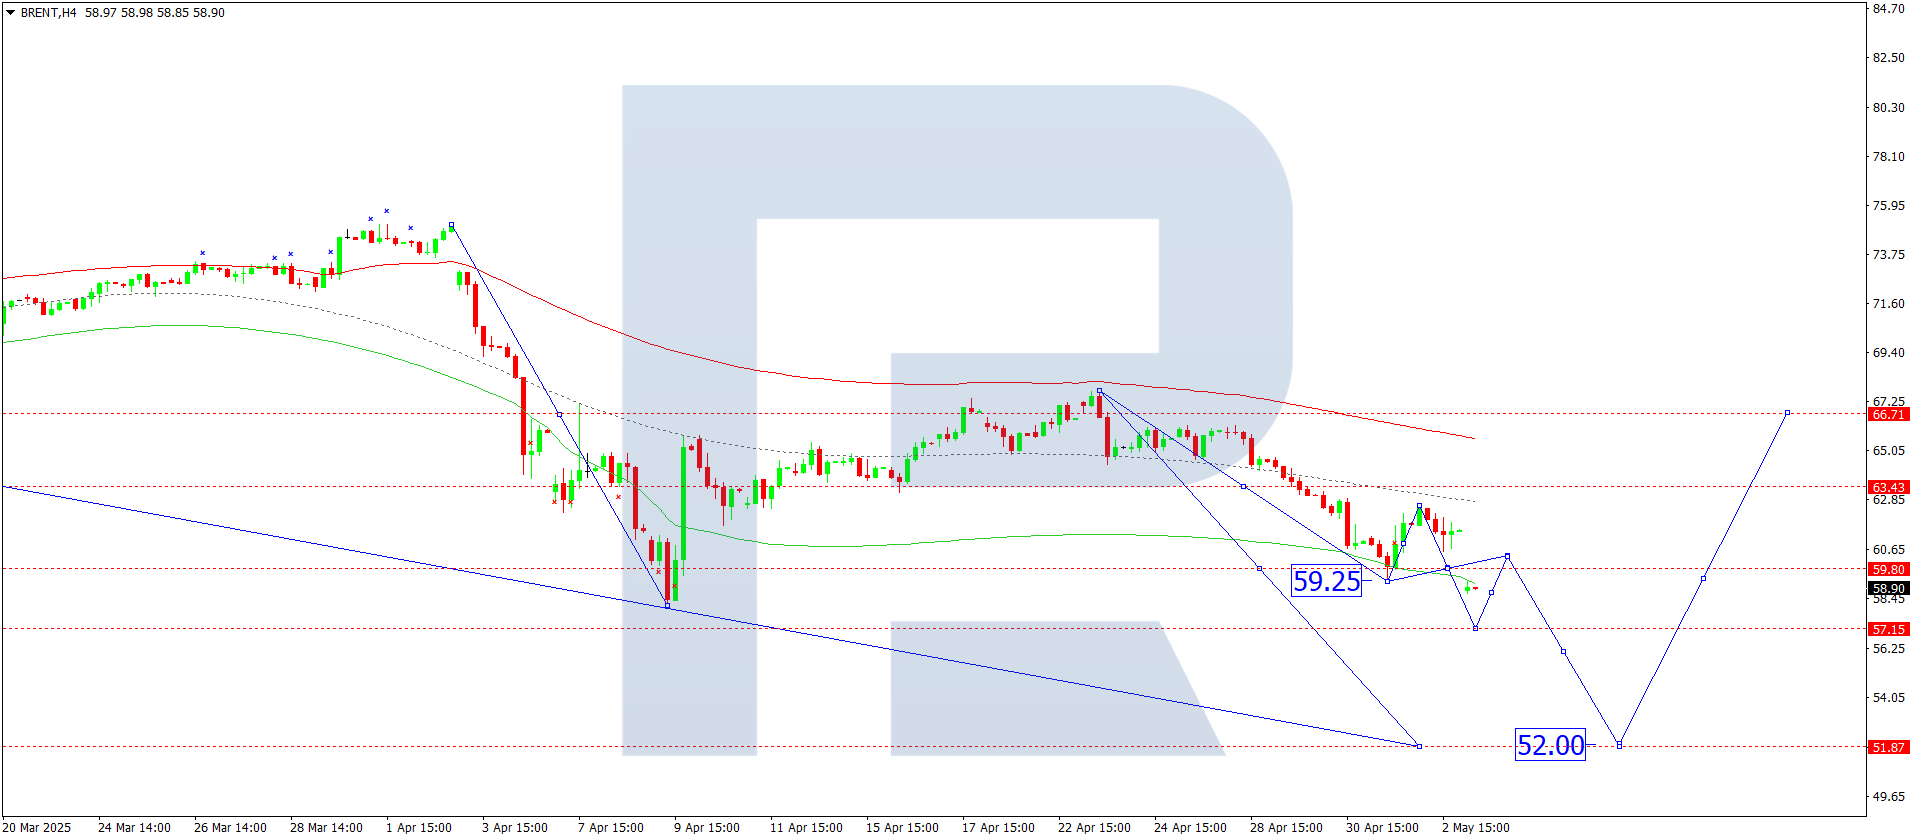
On the H4 chart, Brent crude completed a downward wave to 59.25 followed by a correction to 62.58. On 5 May 2025, the price broke below 59.80 and is expected to continue declining to 57.15, with potential for an extended drop to 52.00.
This outlook is supported by the Elliott wave structure and a decline wave matrix with a pivot at 66.71. This pivot acts as the key level. Currently, the price is heading towards the lower boundary of the price Envelope at 57.15. Upon reaching this target, a rebound towards the central line at 59.80 is likely.
Technical indicators for today’s Brent forecast suggest continued downward movement towards 57.15.
Forecasts presented in this section only reflect the author’s private opinion and should not be considered as guidance for trading. RoboForex bears no responsibility for trading results based on trading recommendations described in these analytical reviews.